Explore a large U.S. flights dataset that includes one row for every U.S. flight between January 2022 and July 2025 for a total of 26.3 million rows. Columns include departing and arriving airports, airline, flight number, scheduled departure, minutes flight delayed, and flight cancelled. Explore for free in a Row Zero spreadsheet.
Flight Dataset Summary
This spreadsheet includes 26.3 million rows of U.S. flight data from the Bureau of Transportation Statistics from 2022 to 2025. There is one row for each U.S. domestic flight. 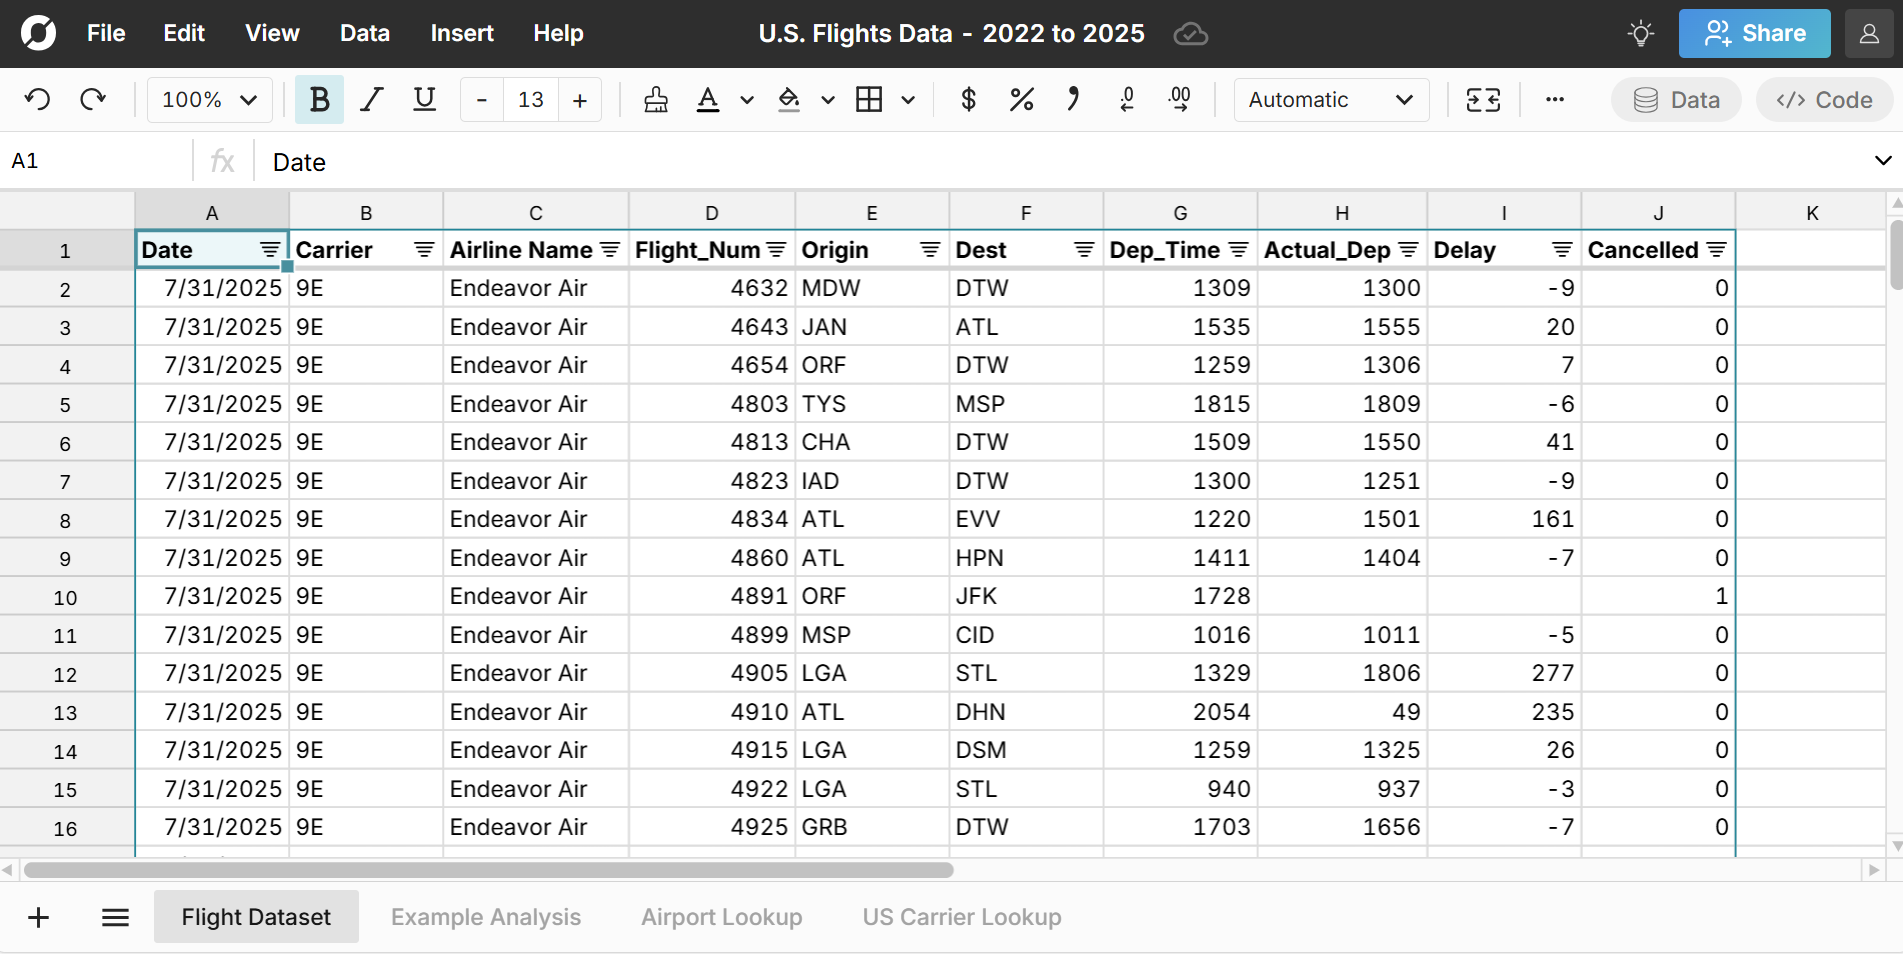 Columns include Date, Carrier Code, Airline Name, Flight Number, Origin, Destination, Scheduled Departure, Actual Departure Time, Flight Delay (in minutes), Cancelled (flight cancellations are recorded as "1"). Note that you can download new months and additional flight data fields from the BTS TranStats website and open in Row Zero. Row Zero is a spreadsheet for big data that can easily open files too big for Excel.
The workbook contains 4 sheets:
- Flight Dataset (all raw data)
- Example analysis
- Airport Code Lookup, which maps U.S. airports to their IATA codes
- U.S. Carrier Lookup, which maps U.S. airlines to their carrier code
Highlights from the Dataset:
Busiest U.S. airports by domestic flight volume:
These were the busiest airports in 2024:
- ATL - Atlanta Hartsfield International Airport - 342,624 flights
- ORD - Chicago, O'Hare International Airport - 318,173 flights
- DFW - Dallas/Fort Worth International Airport - 315,695 flights
- DEN - Denver International Airport - 313,314 flights
- CLT - Charlotte/Douglas International Airport - 252,441 flights
Days with the most flights
Sunday after Thanksgiving was the day with the most flights in 2024 and is consistently the busiest travel day of the year. The next busiest travel days were Thursdays and Fridays in October and Fridays in July.
Days with the least flights
Thanksgiving day was the least busiest travel day followed by Saturdays in mid-January to mid-February.
Days with the most flight delays
Holiday travel stood out with the most flight delays. One of the worst days to travel was 12/29 with 47% of flights delayed 10+ mins and 12/28 and 12/21 were close behind with 41% of flights delayed 10+ min. While these days have a lot of flight delays they were below average for flights cancelled.
Largest U.S. Airlines by Flights:
These were the airlines with the most flights in 2024
- Southwest - 1,419,419 flights
- Delta - 1,009,194 flights
- American - 984,306 flights
- United - 760,451 flights
- SkyWest - 744,637 flights
Airport with the most direct flights:
DFW (Dallas Fort Worth) offered the most direct flights in 2025 with 184 direct flight destinations in the U.S. Here's the top 5 airports with most direct flights:
- DFW - 184
- DEN - 182
- ORD - 176
- ATL - 158
- CLT - 139
Example Analysis
We can quickly create a few pivot tables and charts to analyze this airline dataset.
First, we'll create a pivot table to look at total flights, flight delays, and flight cancellations by airport. We can look at delays in a few ways - mean, median, 90th percentile (gives us the 10% worst delays) using the pivot table calculations. We can also use XLOOKUP to join with another pivot table that filters to flights delayed 10+ mins. Next, we can add calculated columns onto our pivot table to see the percent of flights delayed and cancelled at U.S. airports. 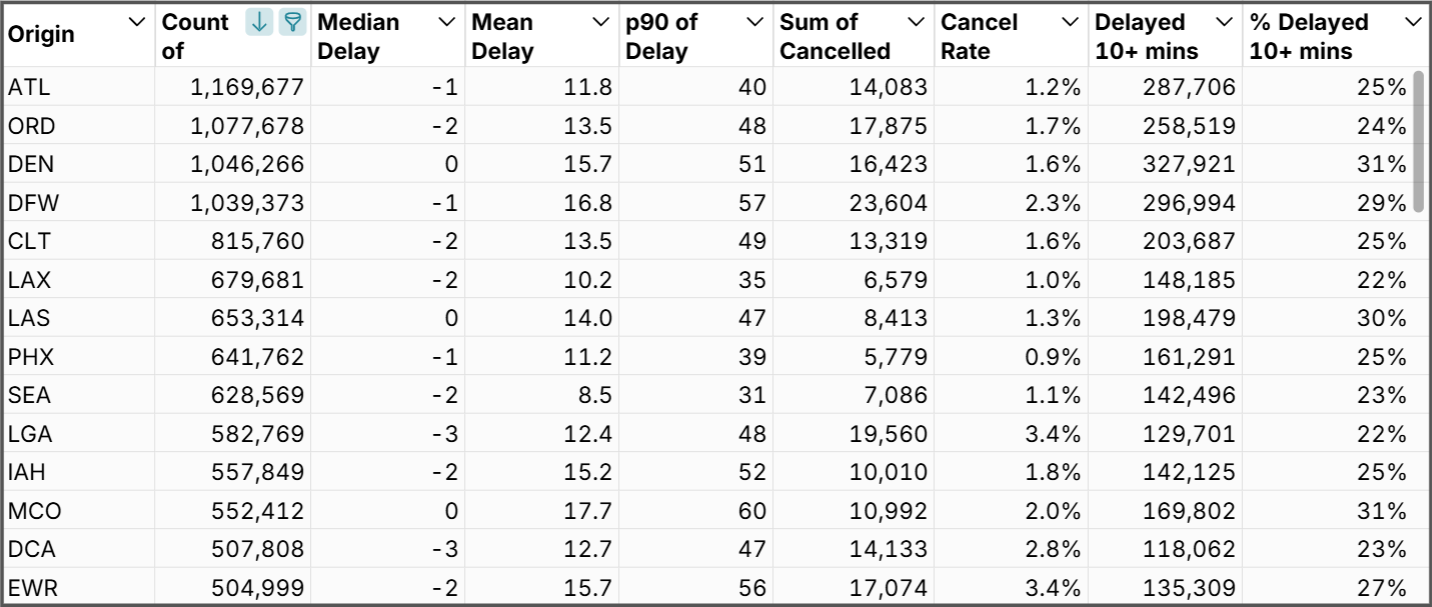
We can insert a chart to better visualize the data. 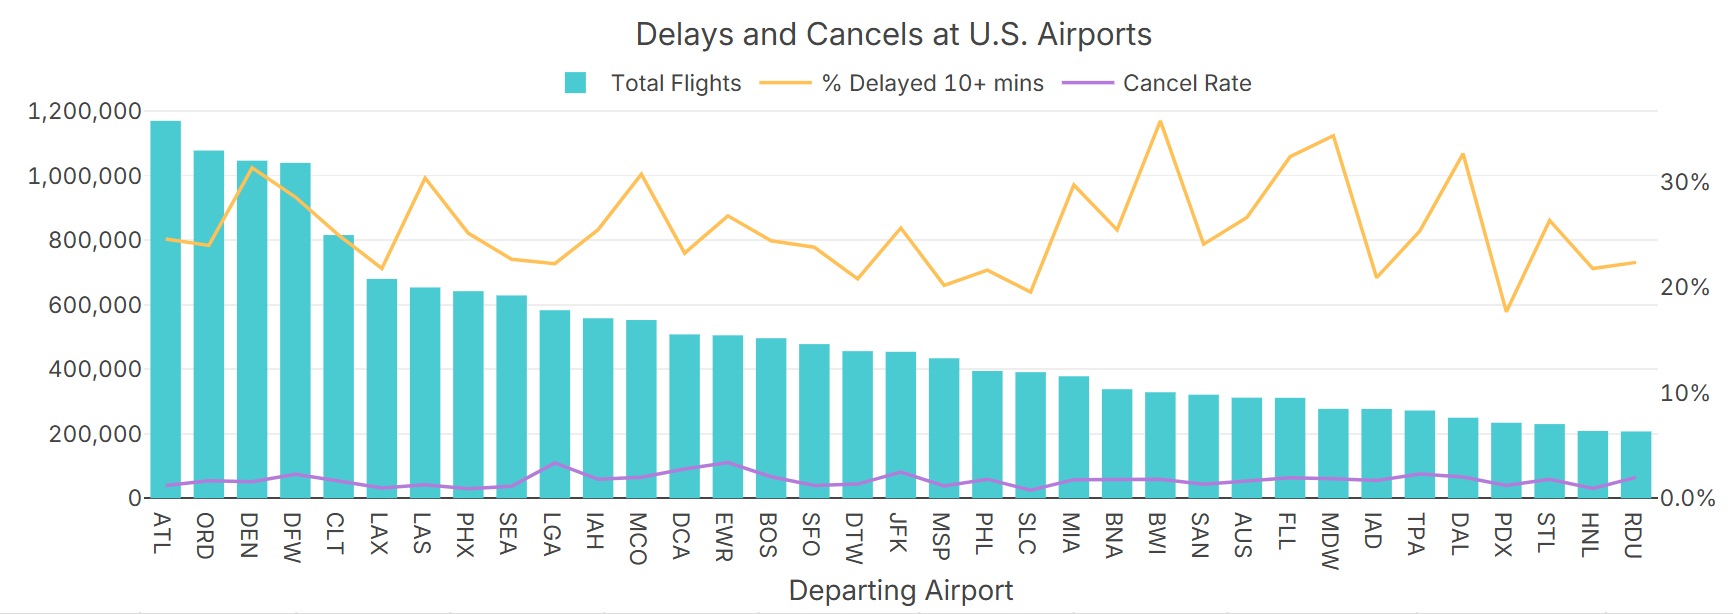
Next we can look at cancels and delays by departure time to see that flights are more likely to be delayed and cancelled later in the day, whereas morning flights have the fewest delays and cancellations. 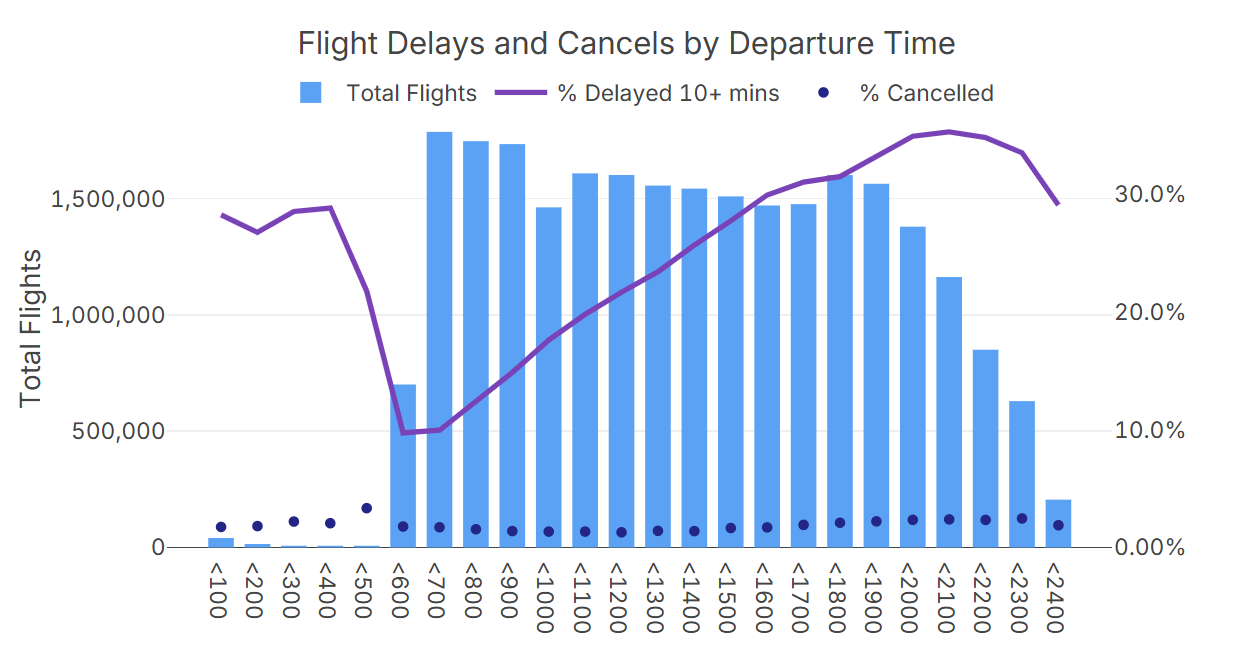
We can also look at U.S. flight delays by airline. Here we see that the median flight delay is typically less than zero, meaning the typical flight is on time. However, we can use a pivot table to calculate percentile values, to show a more interesting story. Looking at the 90th percentile delay for each airline (p90 of Delay) shows the 10% worst flight delays for each airline. Here you can see that it's not uncommon to have flight delays over 30 mins. 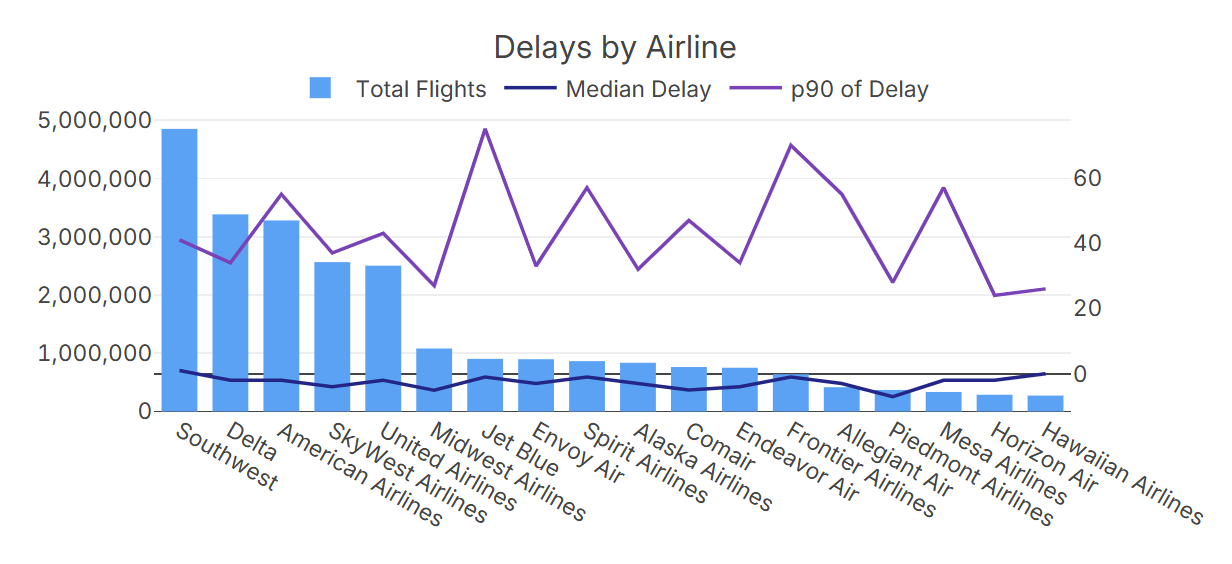
We can use a unique Row Zero feature to analyze the busiest days to travel and worst days to travel. Row Zero pivot tables group by date, so you can summarize pivot table data by day, week, month, quarter as well as hour, minute, second. Below we aggregate all of the flights by day and sort to see the days with the most flights and days with the most flight delays. 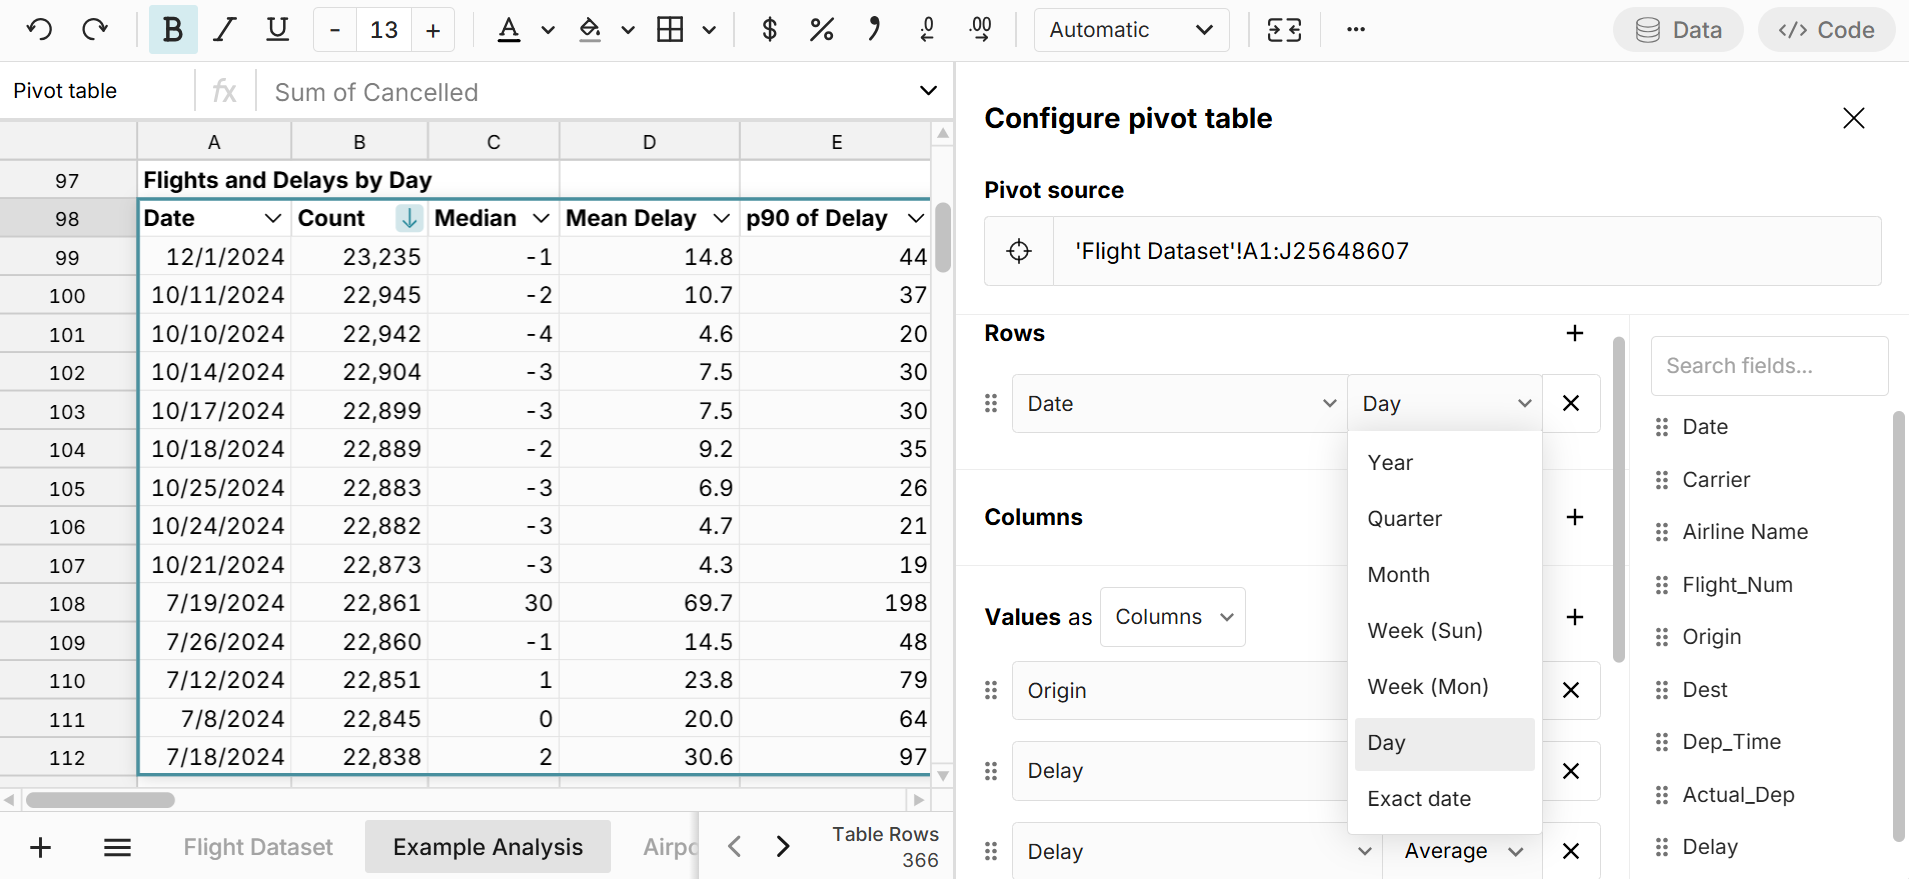
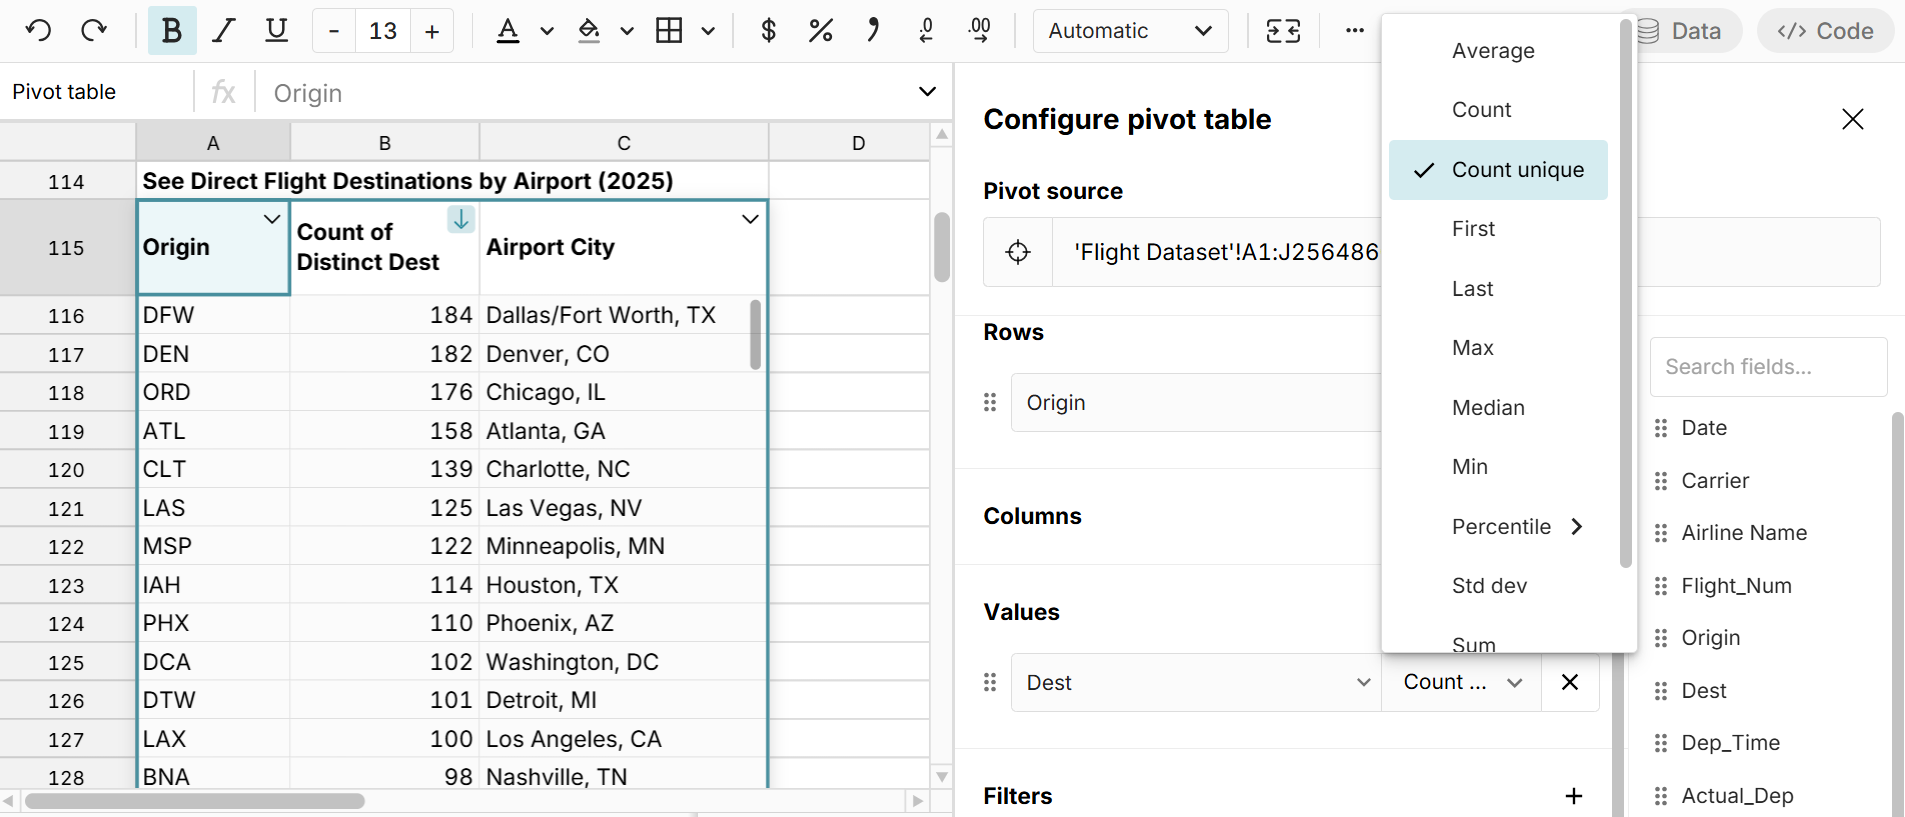
Finally, we can use another unique Row Zero feature, pivot table count unique, to quickly see the number of direct flight destinations out of each airport: