Explore the latest World Development Indicators data from the World Bank in a spreadsheet. Analyze more than 1,500 indicators across health, economy, energy, and demographics by country by year. Row Zero is a powerful spreadsheet built for big data that makes it easy to open and analyze WDI datasets in a spreadsheet. To demonstrate, we've imported the full WDI database into Row Zero and built out some basic lookups and analysis to help you get started. You can explore the WDI spreadsheet for free.
Open WDI Dataset in a Spreadsheet
Dataset Summary
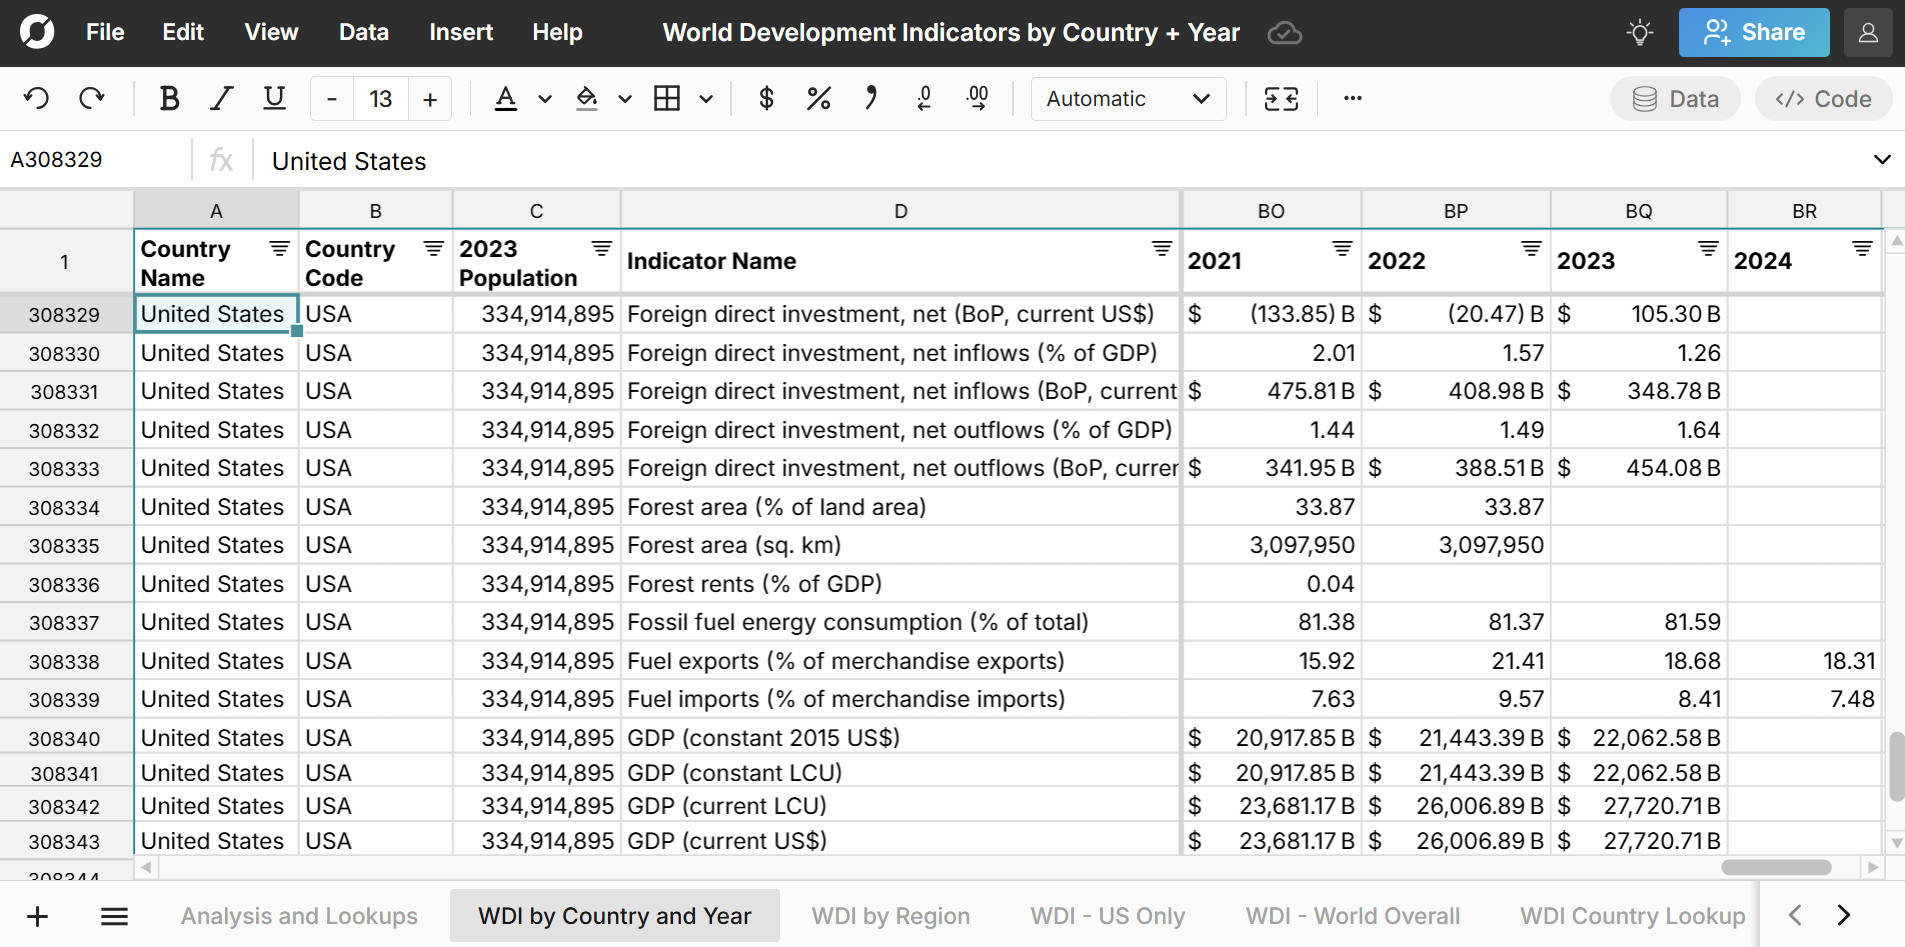 The WDI dataset includes more than 1,500 world development indicators by country and by year. Compare country statistics across dozens of categories including demographics, health, economy, development, government, and more. Development indicators also include global population by country by year and factors contributing to global population change, including birth rate, death rate, and migration by country. The spreadsheet includes the full database of World Development Indicators from the World Bank. Download the latest raw WDI dataset here or jump right into the pre-built spreadsheet of WDI data.
The dataset includes the following sheets:
- Analysis and Lookups - Example WDI lookups and pivot tables of WDI data
- WDI by Country and Year - Full dataset of world development indicators by country by year back to 1960.
- WDI by Region - WDI dataset by region by year back to 1960.
- WDI - US Only - Full WDI dataset for US only
- WDI - World Overall - Overall global development indicators aggregated to world level
- WDI Country Lookup - Lookup sheet for each country with more info on each
- WDI - Series Info - Lookup sheet for each series with more info on each
- WDI Country Series Data Sources - Data sources for each WDI indicator
- WDI Series-time - Additional detail on data source timing
- WDI Footnotes - Footnotes provided in the original WDI dataset
- WDI CSV (raw data) - The raw WDI CSV from World Bank DataBank
- Data Source - Information about the data source with link to download
Highlights from the dataset
The WDI dataset provides significant insights into the state of the world, from economics to politics to demographics and energy production. You can drill down to compare country statistics or see how a particular country is trending over time compared to other countries and the world overall. The Analysis and Lookups sheet contains several WDI lookups and pivot tables of WDI data to help you get started. Click inside any pivot table to edit the development indicator, year, and applied filters. Here are some highlights from the example WDI analysis:
Net Income Per Capita by Country
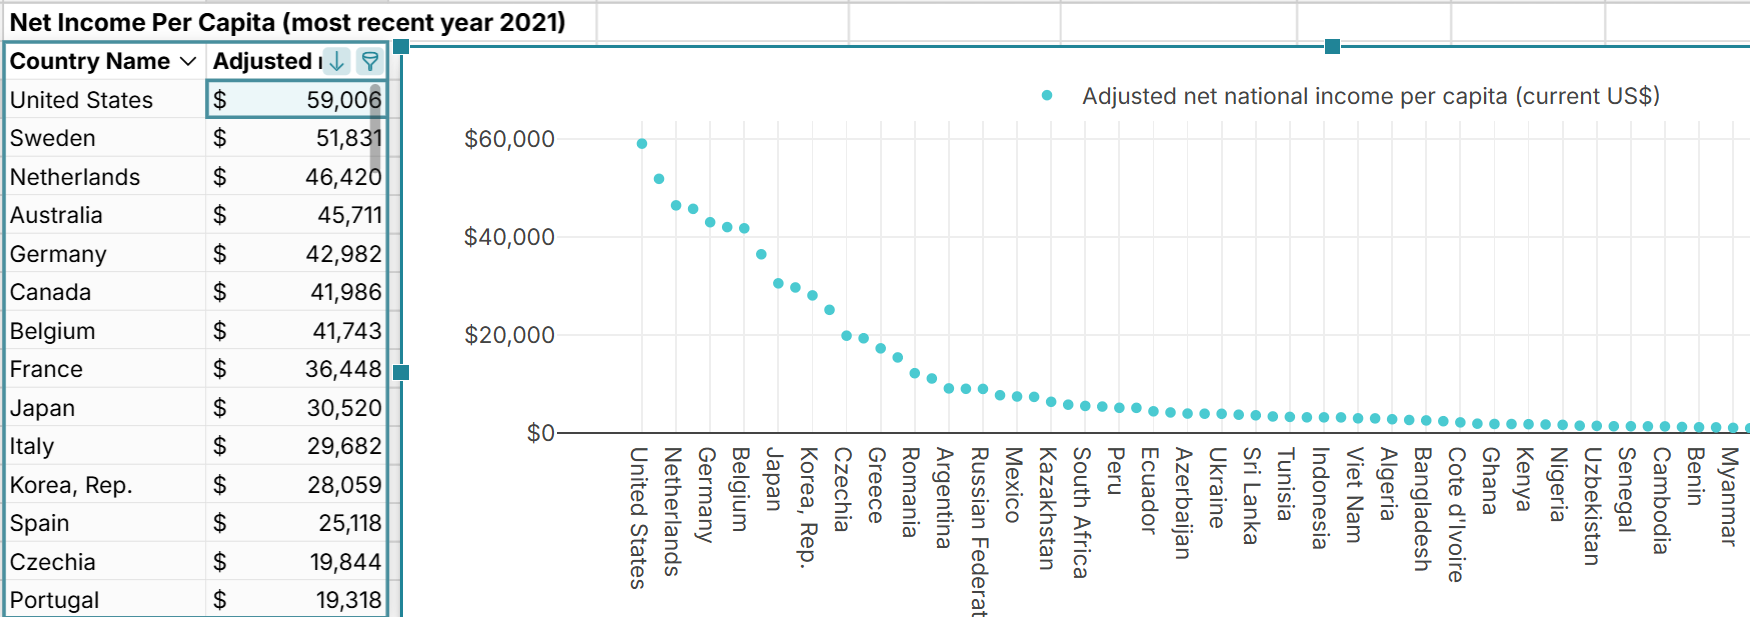 Comparing net income per capita by country shows that the United States is the country with the highest income per capita and is a clear outlier in the data.
Immigration by Country
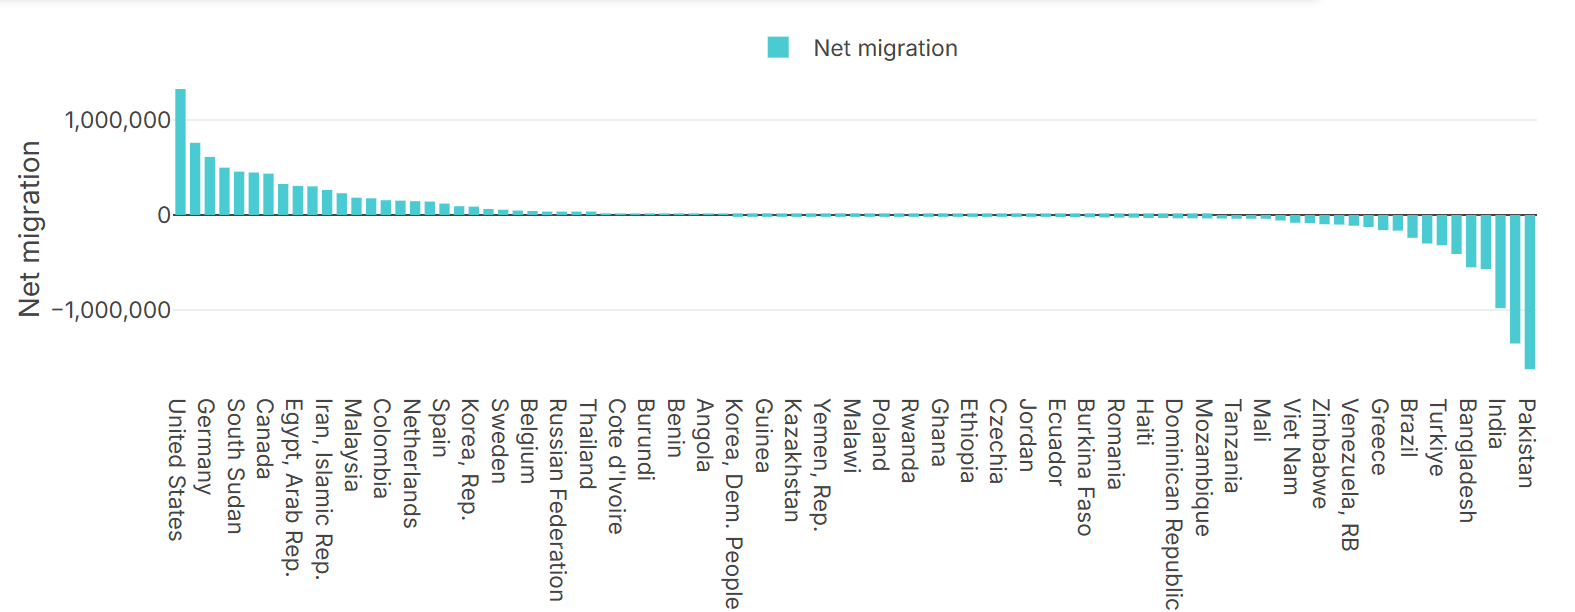 Comparing immigration stats by country shows how the United States has the most net immigration by a wide margin in the most recent year available (2023).
Looking specifically at asylum seekers by country, we see the U.S. received the most asylum seekers by far. 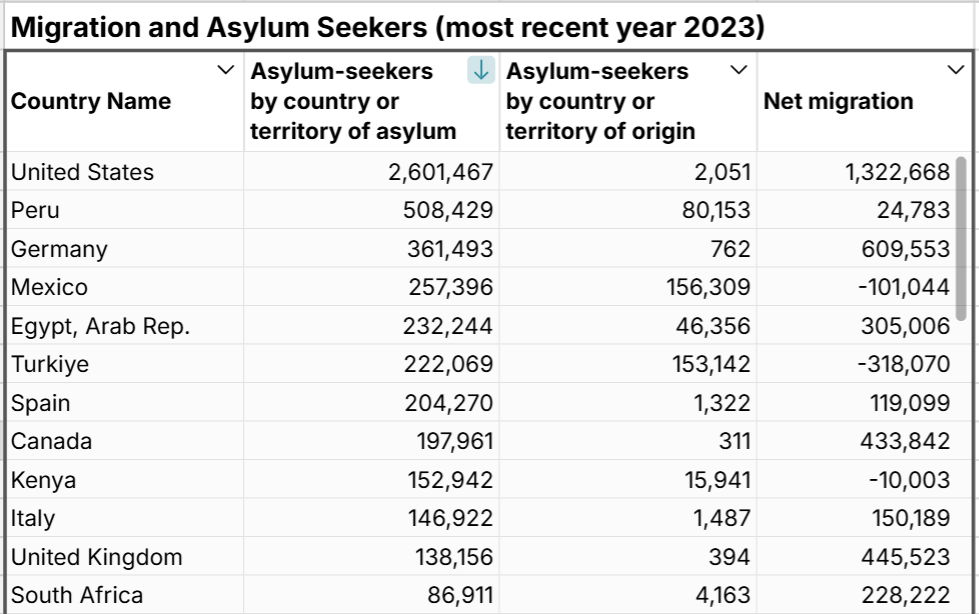
Venezuela was the largest source of asylum seekers in terms of asylum country of origin. 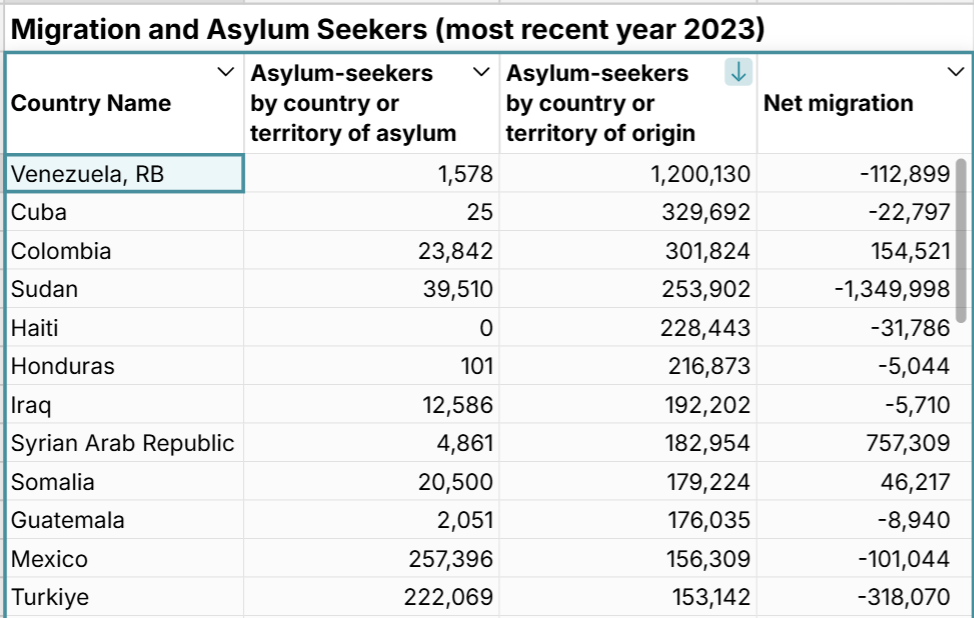
Birth and Death Rates by Country
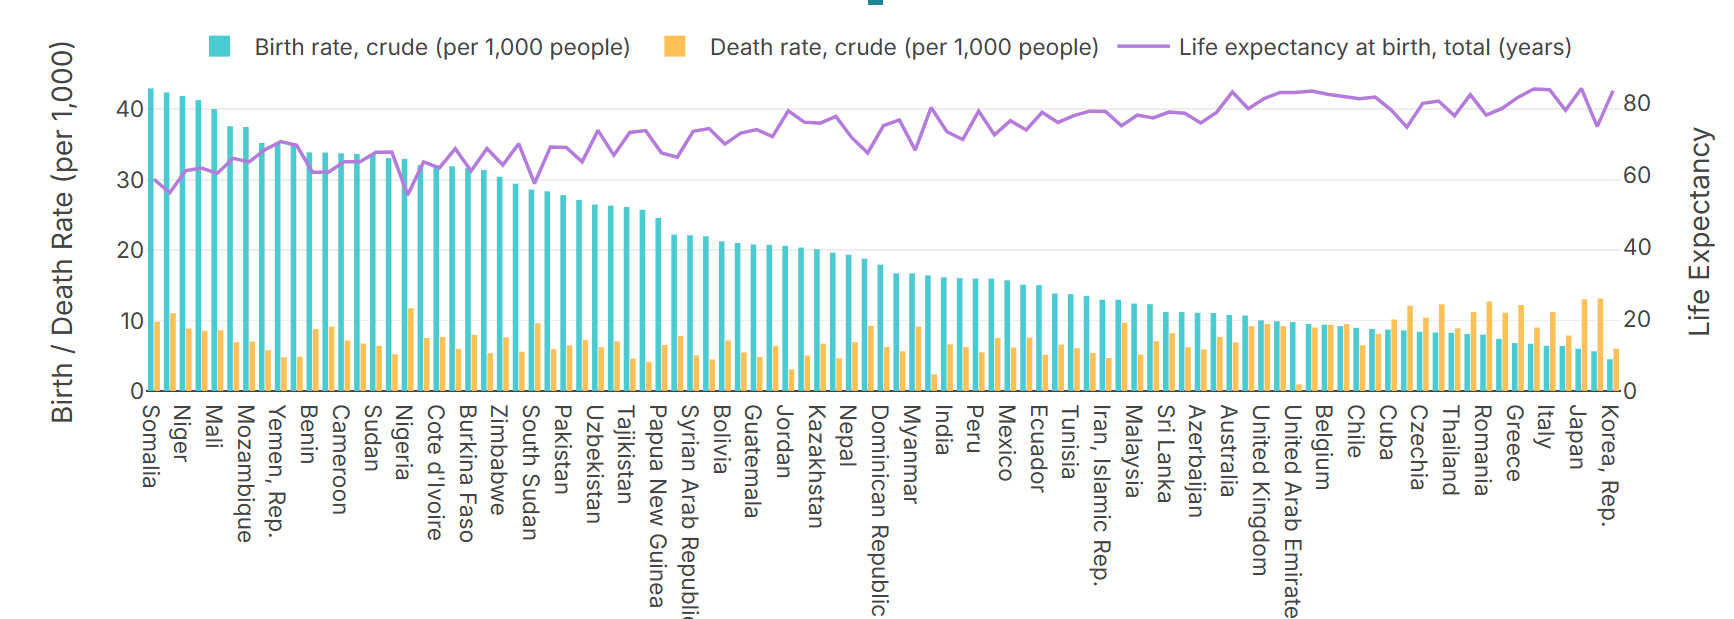 Comparing birth and death rates by country shows an interesting relationship between birth rates, death rates, and life expectancy. You can drill down to see the countries with population decline where the death rate is higher than birth rate per 1,000 people.
Health Spending and Life Expectancy
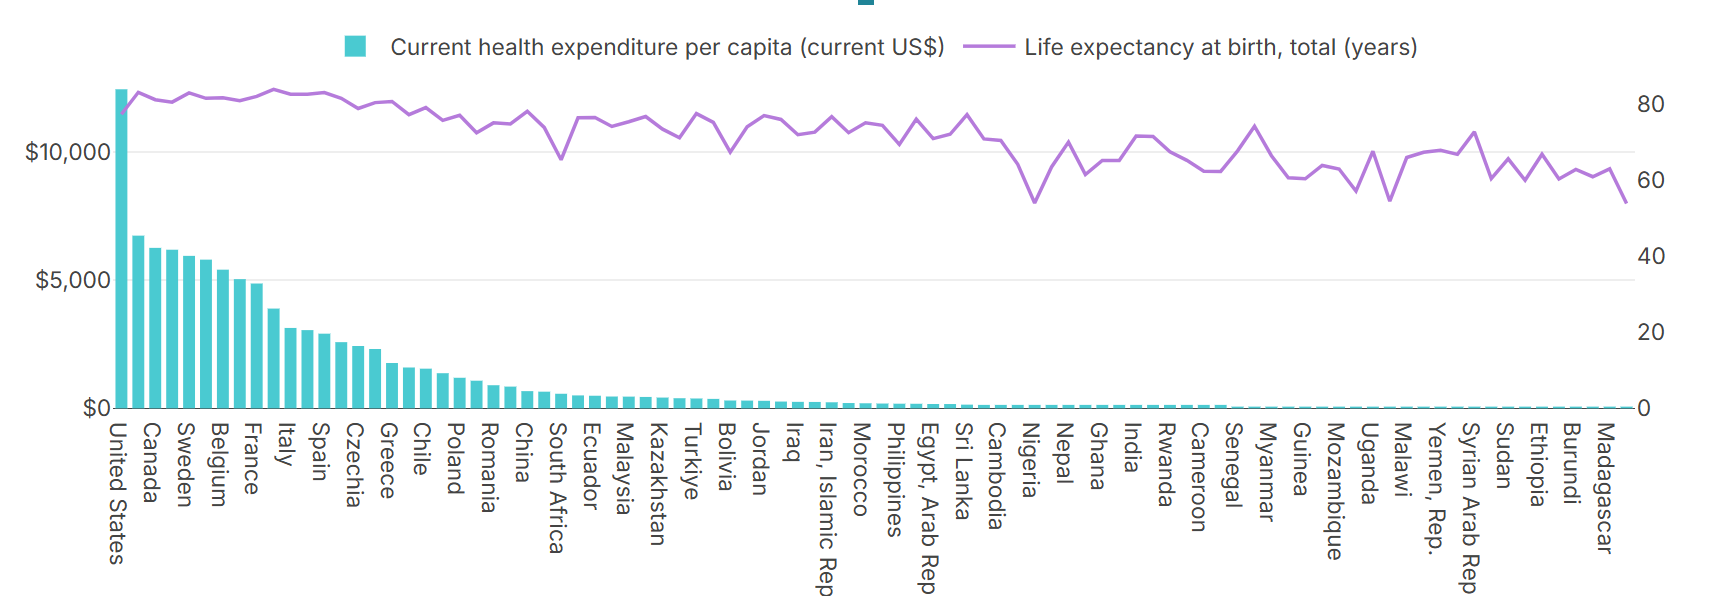 Comparing health spending vs life expectancy by country shows how much of an outlier the United States is. The U.S. spends twice as much as any other country on healthcare and 4 times what most developed countries spend, but the U.S. has a lower life expectancy than most developed nations.
CO2 Emissions and Electricity Production
The WDI dataset includes several statistics related to greenhouse gas emissions, energy use, and electricity production. The countries with the most CO2 emissions per capita tend to be the largest producers of oil and coal, including the UAE, Saudi Arabia, Russia, Canada, and the United States. 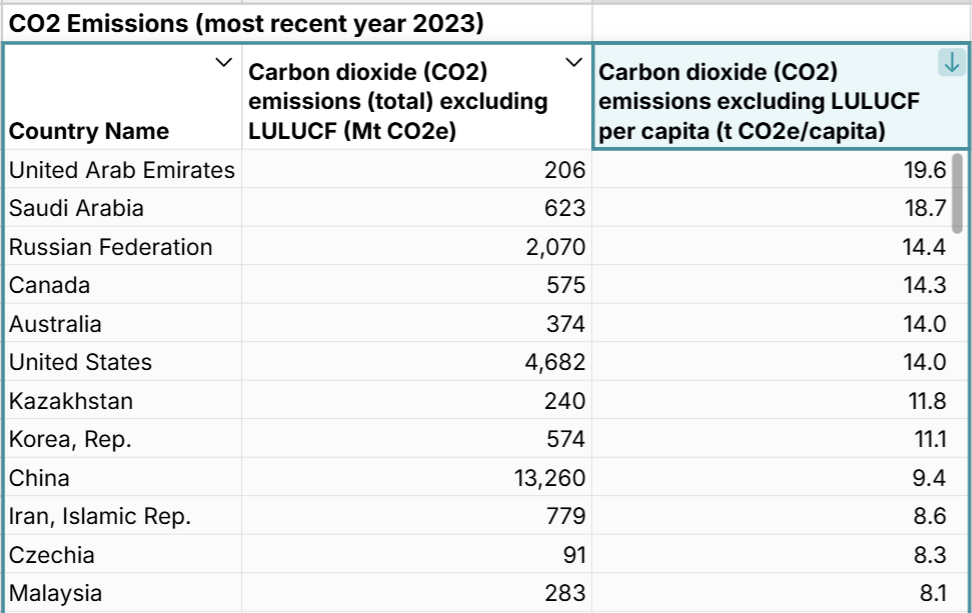 The top 5 countries with the most CO2 emissions in 2023 were:
- China: 13,260 Mt
- United States: 4,682 Mt
- India: 2,955 Mt
- Russia: 2,070 Mt
- Japan: 945 Mt
You can drill down further to see electricity production by source by country. 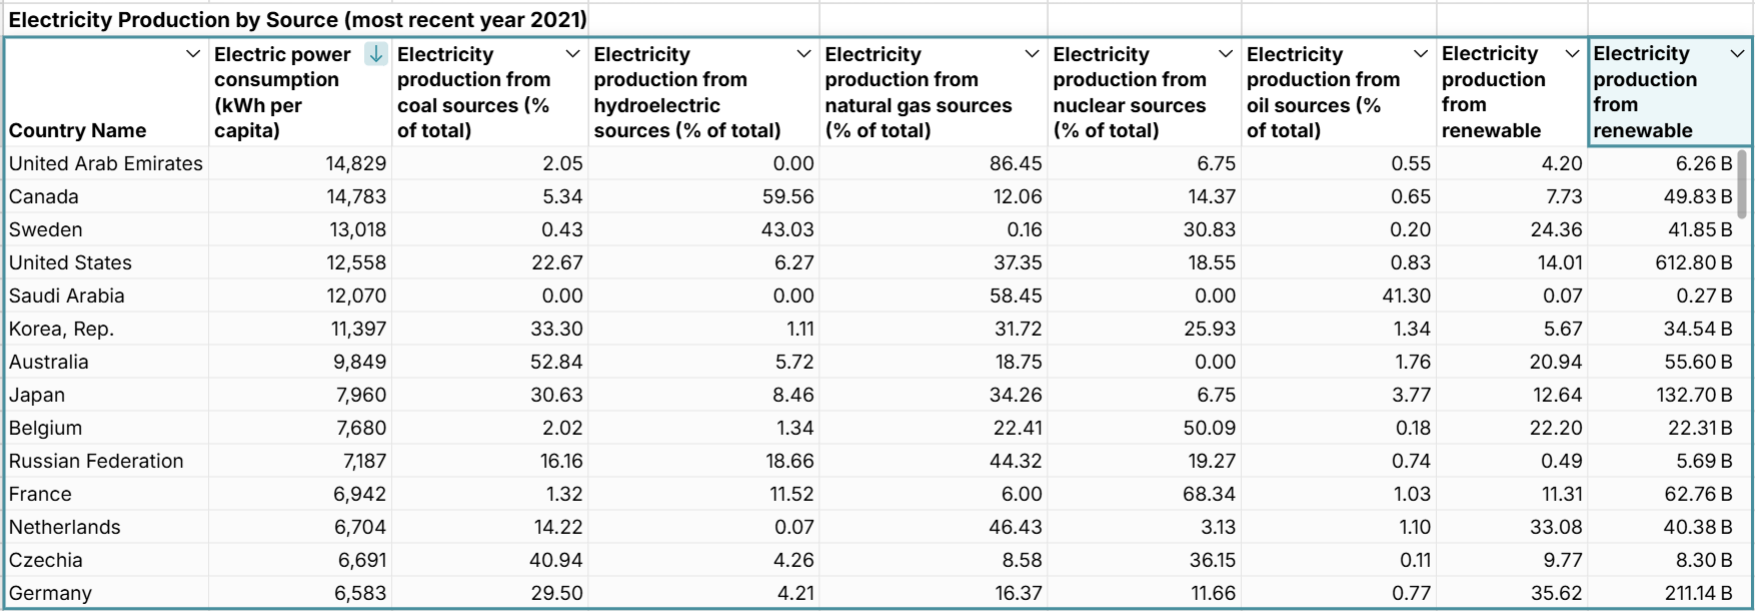 The top 5 countries with the most electric power consumption per capita (kWh)
- United Arab Emirates: 14,829
- Canada: 14,783
- Sweden: 13,018
- United States: 12,558
- Saudi Arabia: 12,070
China and the U.S. lead with the most overall electricity production from renewal sources while France leads with the highest percentage sourced from nuclear energy.
Alcohol Consumption per Capita
The WDI dataset offers several detailed statistics on consumption and health indicators. One interesting one to look at is total alcohol consumption per capita to see what countries drink the most alcohol per capita. 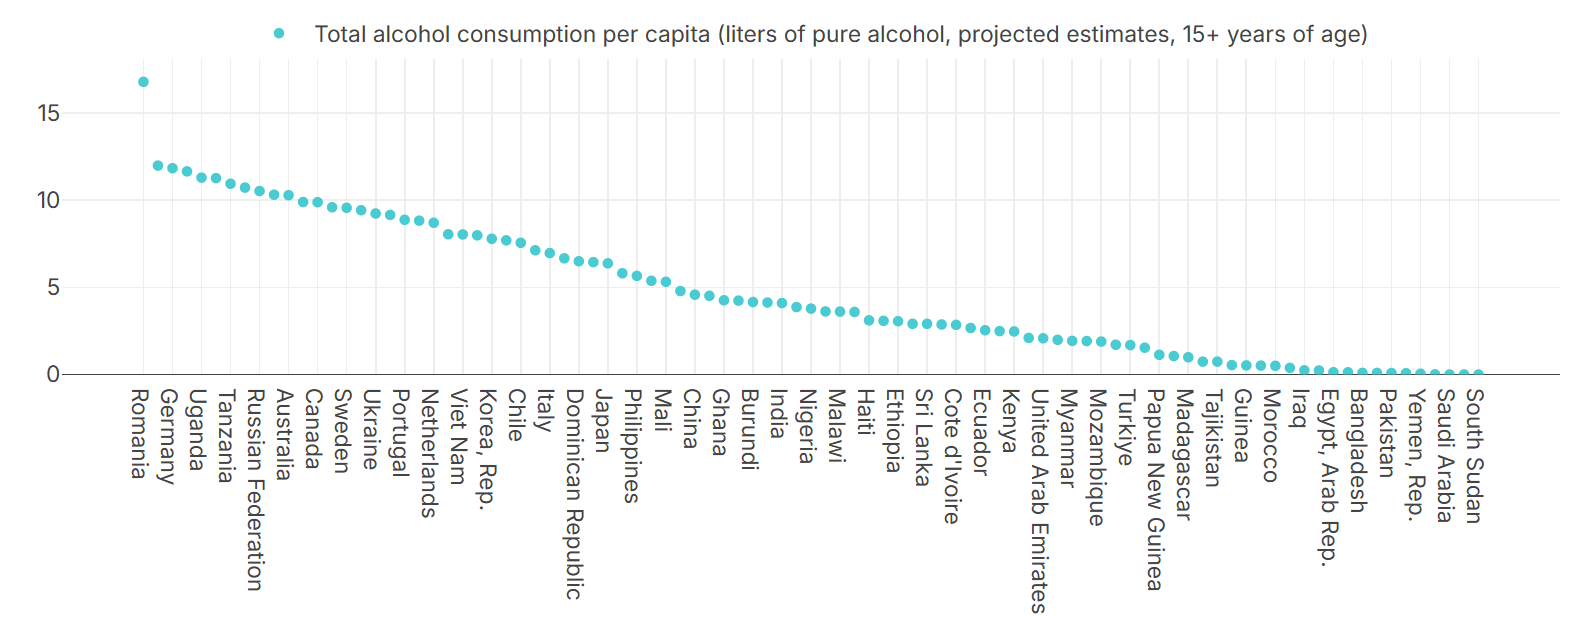 Romania is the clear outlier with 16.8 liters of pure alcohol per resident over 15, with Czechia, Germany, Poland, and Uganda rounding out the top 5 countries with the most alcohol consumption.
Global Inflation by Country by Year
The WDI dataset includes detailed economic statistics like GDP growth, production by industry, and global inflation by country by year. 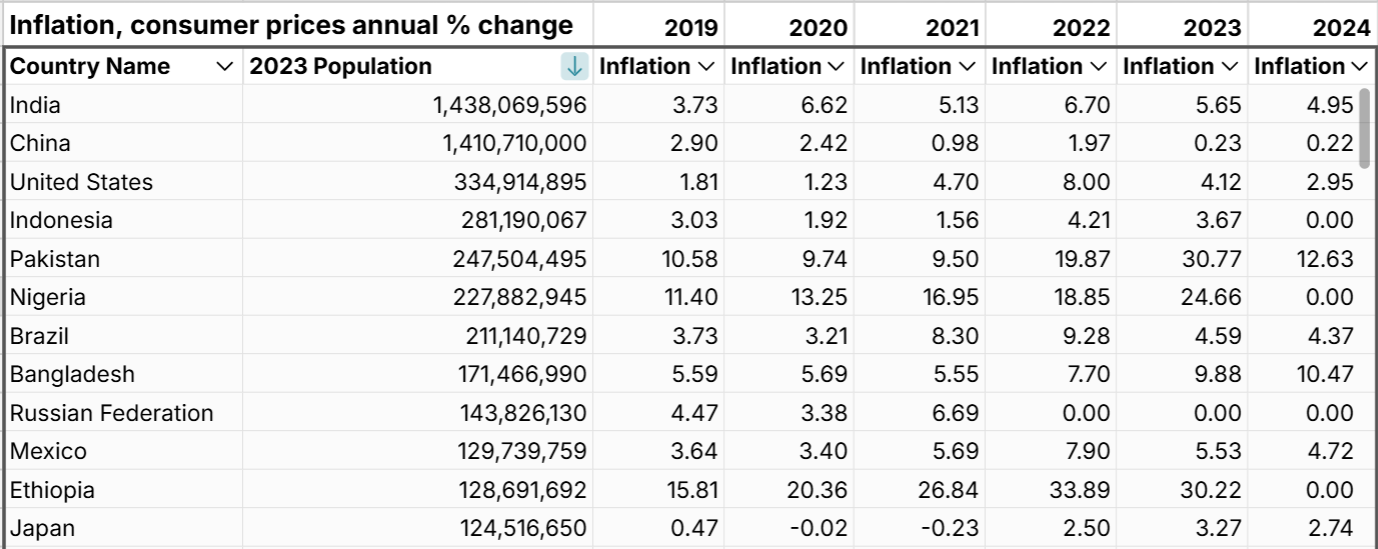 Comparing inflation by country reveals very significant differences in consumer price inflation globally with many large countries experiencing multiple years of double-digit inflation.
Arms Exports and Size of Armed Forces
The WDI dataset also includes military statistics including arms exports by country, arms imports by country, size of each country's military, etc. 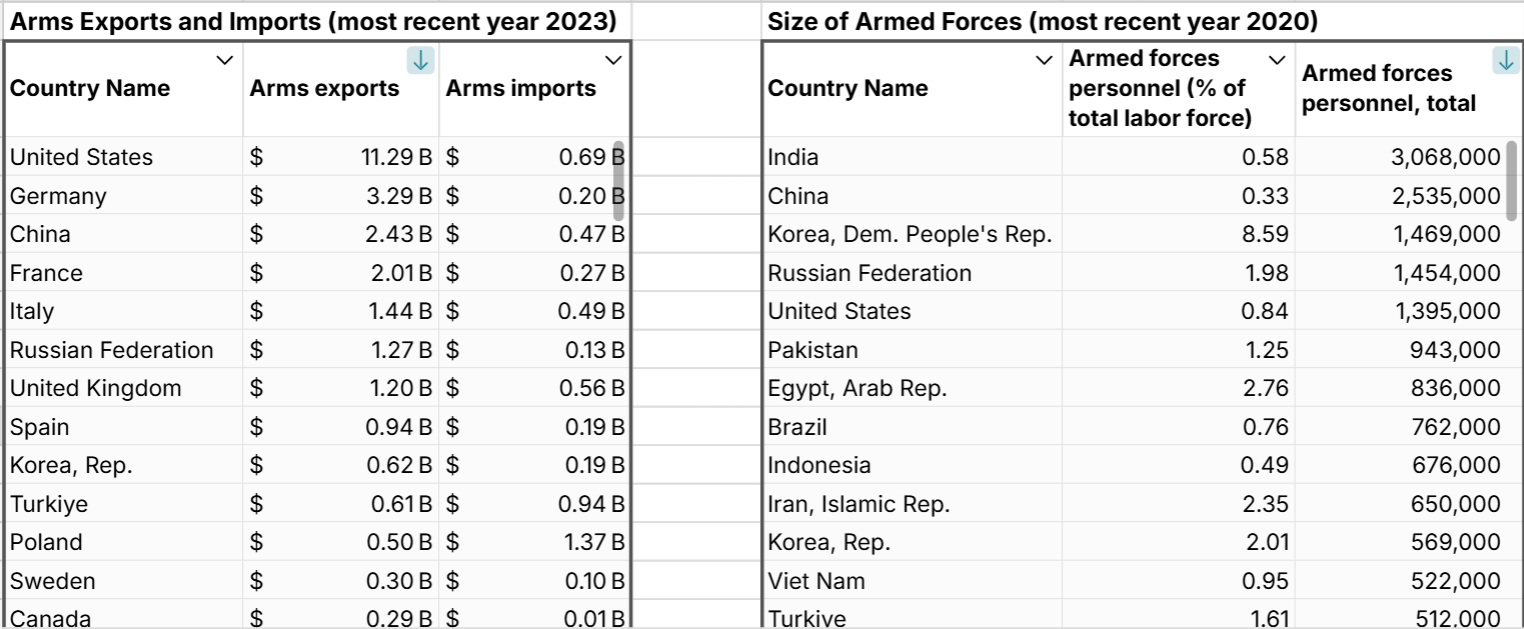 The United States is the largest arms exporter by a wide margin followed by Germany, China, France, and Italy.
Foreign Direct Investment by Country
The WDI dataset includes detailed statistics on foreign direct investment and net inflows and outflows of capital by country. 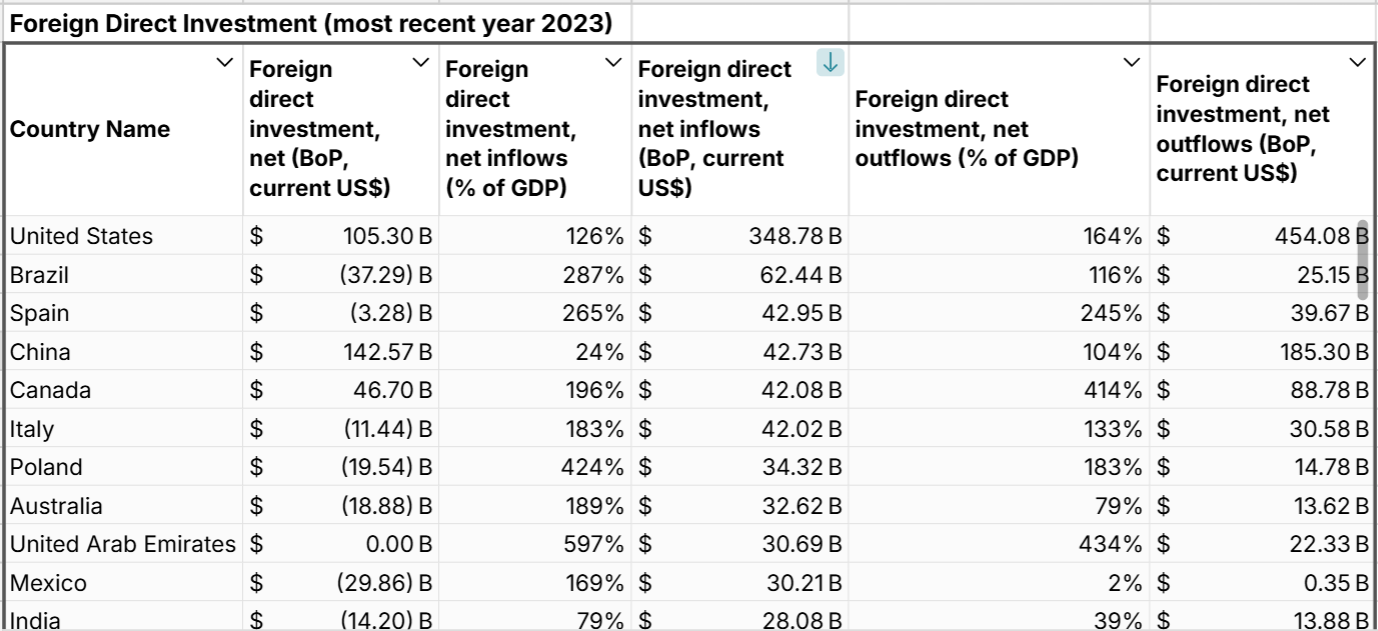 Looking at the historical data, foreign direct investment and capital flows tend to shift quickly as economic and political conditions change globally.
These examples of world development indicators are just a small sample of the more than 1,500 statistics available in the WDI database. You can also explore any WDI across years to see trends over time. Explore the WDI spreadsheet to dive deeper.
Data Sources
The data source for the World Development Indicators dataset is The World Bank DataBank. To access the latest WDI data visit the link above and scroll down to 'Access Datasets' to download the WDI CSV which you can then open in Row Zero which has the power to handle large datasets (1000x Excel's limits).  Note the license for the WDI data is CC by-4.0. The spreadsheet has been updated as of April 2025 with the most recent data available.