Explore comprehensive global population data by country in a big spreadsheet. The spreadsheet includes current population in each country, detailed demographic data by country, global population trends since 1950, and world population projections for every country through 2100 across several different scenarios. Explore for free in Row Zero, a next-gen spreadsheet built for big data.
Open Global Population Spreadsheet
Dataset Summary
This spreadsheet includes several different sheets of global population and demographic data from the United Nations Department of Economic and Social Affairs. The dataset includes world population data since 1950 with annual demographic breakdowns for population by country and region. The population dataset includes global population projections by country for more than a dozen different scenarios including current trends, constant fertility rate, and zero migration. 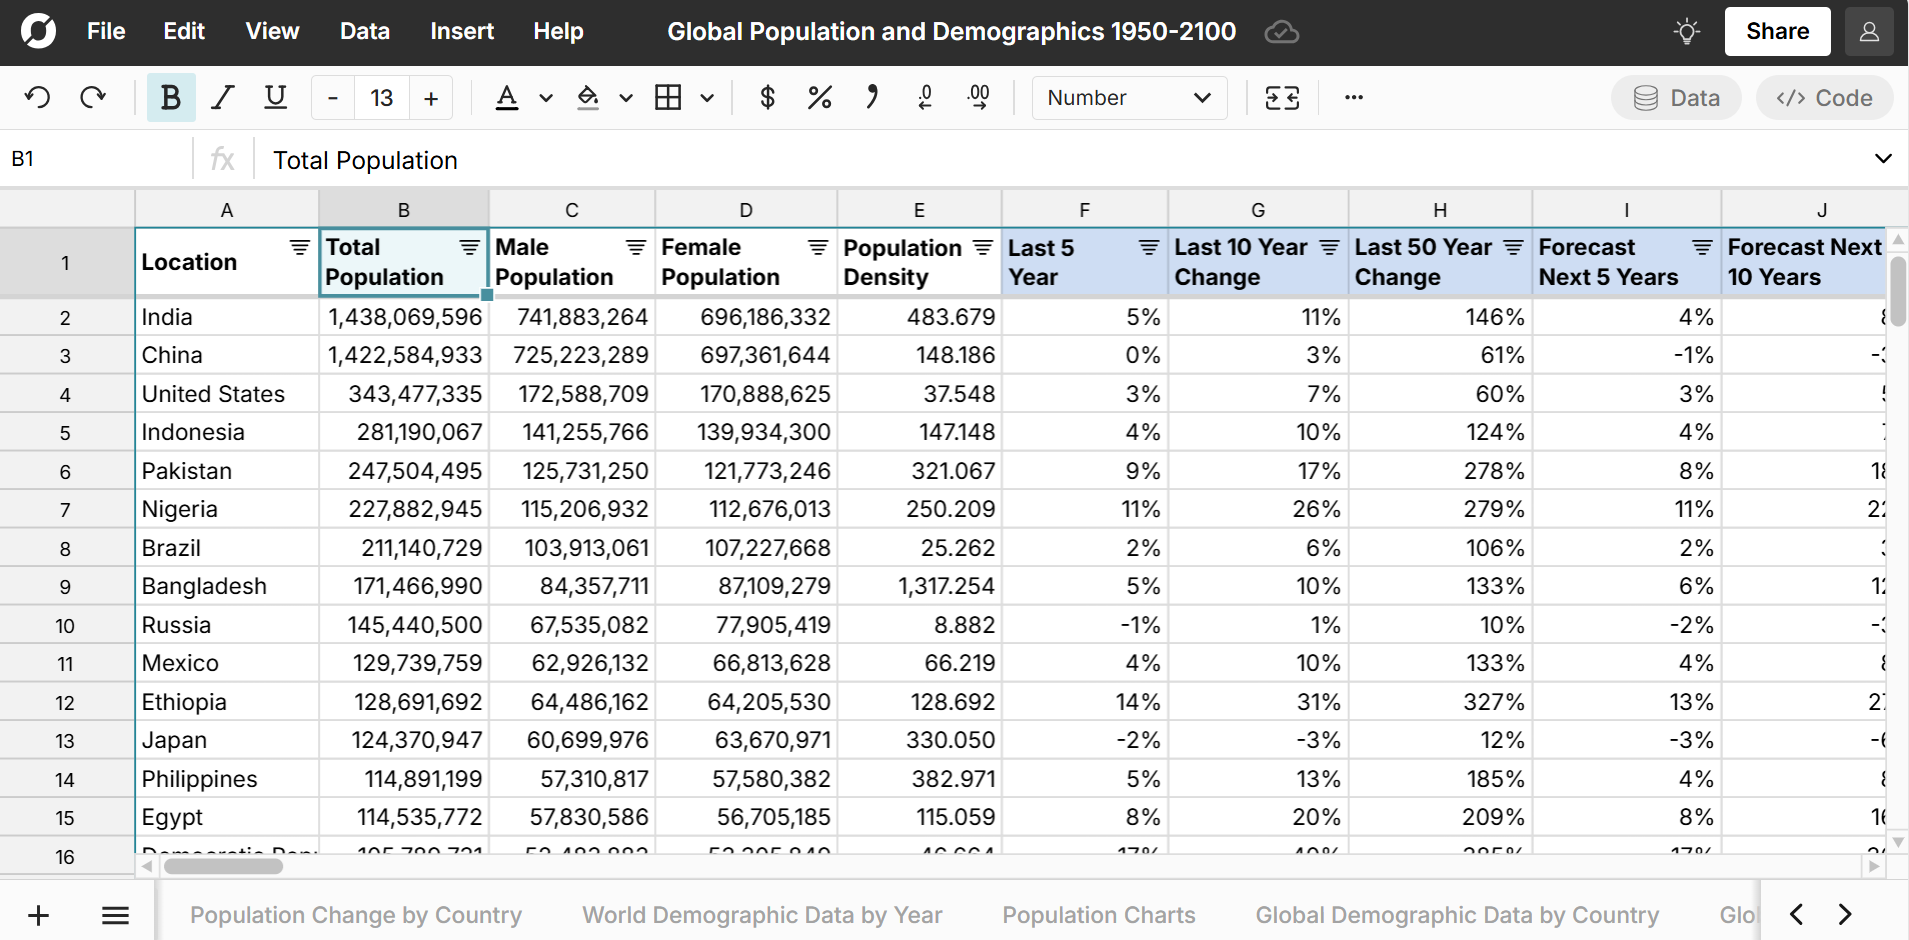
The global demographics dataset includes detailed breakdowns of population statistics for age, gender, birth, fertility, death, and life expectancy by country. 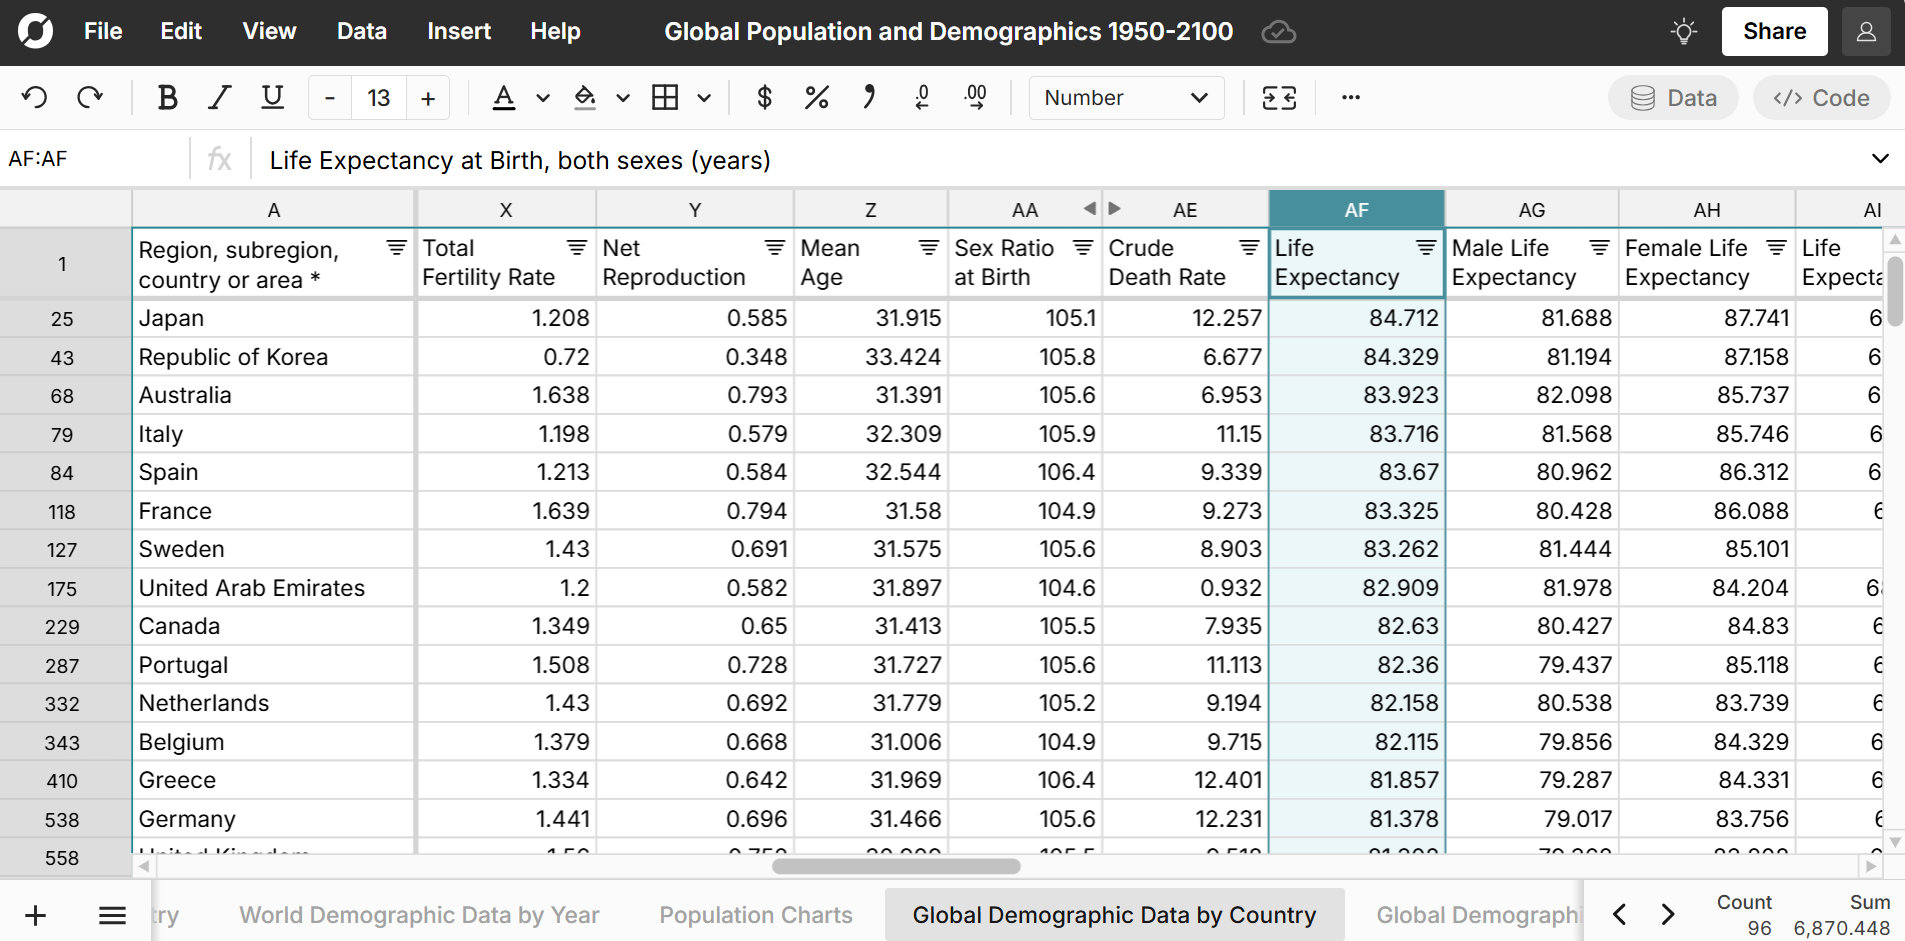
The global demographic dataset includes dozens of population statistics for each country by year since 1950. Columns include Total Population, Male Population, Female Population, Population Density (persons per square km), Population Sex Ratio (males per 100 females), Median Age, Births minus Deaths, Rate of Natural Change, Population Growth Rate, Population Annual Doubling Time, Births, Births by women aged 15 to 19, Crude Birth Rate (births per 1,000 population), Total Fertility Rate (live births per woman), Net Reproduction Rate (surviving daughters per woman), Mean Age Childbearing (years), Sex Ratio at Birth (males per 100 female births), Total Deaths, Crude Death Rate (deaths per 1,000 population), Life Expectancy at Birth and various ages, Male Life Expectancy, Female Life Expectancy, Infant Mortality Rate (infant deaths per 1,000 live births), Live Births Surviving to Age 1, Childhood Mortality Rate, Mortality by gender at various ages, Net Number of Migrants, Net Migration Rate (per 1,000 population).
The workbook contains 10 sheets:
- Basic Lookup: Country Population
- Population Charts
- Global Demographic Data by Country
- World Demographic Data by Year
- Population Change by Country
- Global Demographic Data - All Location Levels
- Population Growth Scenarios by Country
- World Population Growth Scenarios
- Population Growth Scenarios - All Location Levels
- Population 1950 to 2100
Global Population Charts and Analysis
View Interactive Charts and Pivot Tables
We can create pivot tables and charts to analyze the global population over time, identify global demographic trends, and get a sense of how global population is evolving.
Compare Population Growth by Country
Use the Population Charts sheet to chart population growth for all countries. 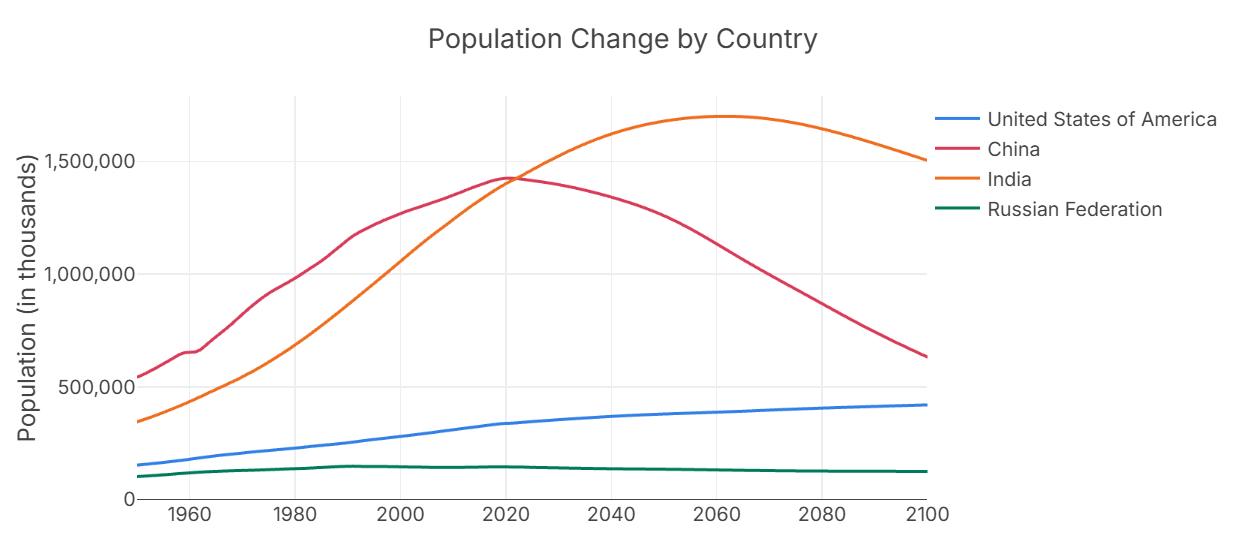
Explore Population Growth Scenarios by Country
Use the template to visualize various population change scenarios. The chart below shows U.S. population growth scenarios. In the spreadsheet, you can double click on the chart to easily chart any country. 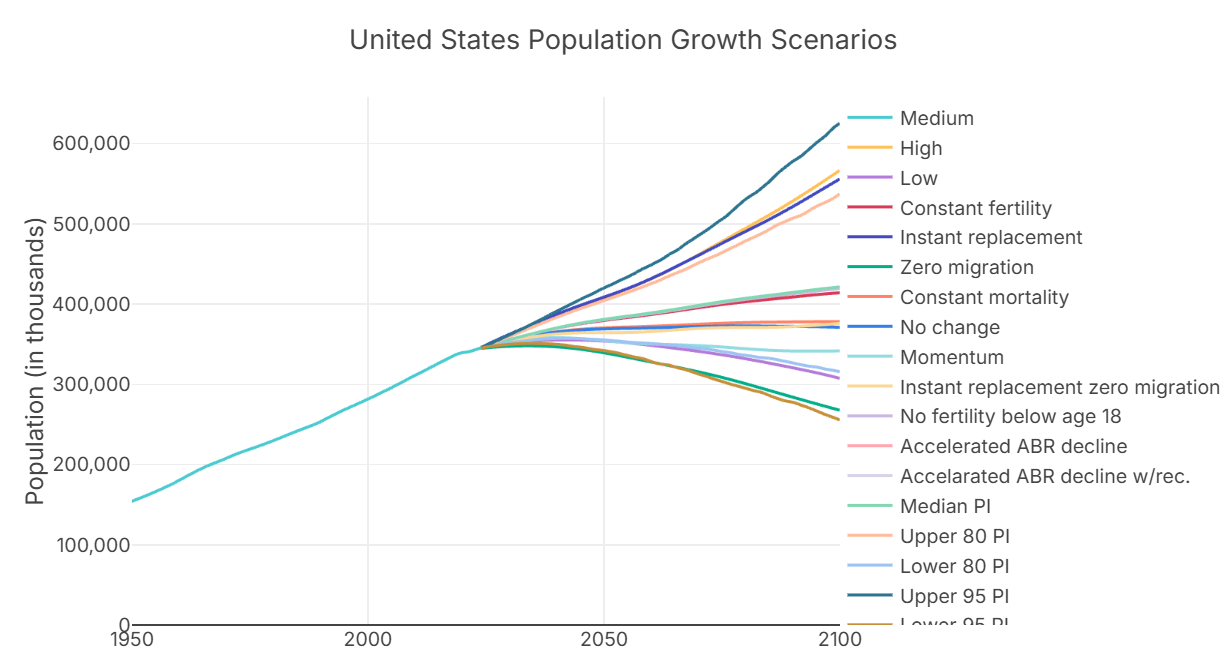
World Population Growth Scenarios to 2100
You can similarly visualize human population projections worldwide across various scenarios. You can also filter by continent, region, and subregion. 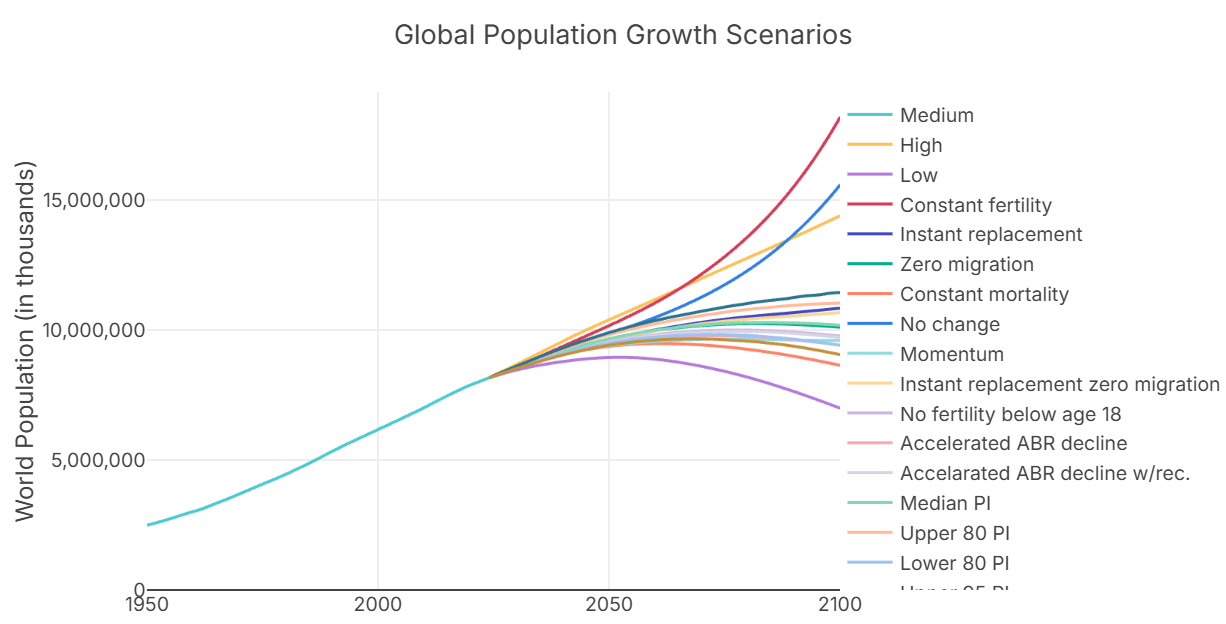
Compare Life Expectancy by Country by Year
See how life expectancy has changed for any country. 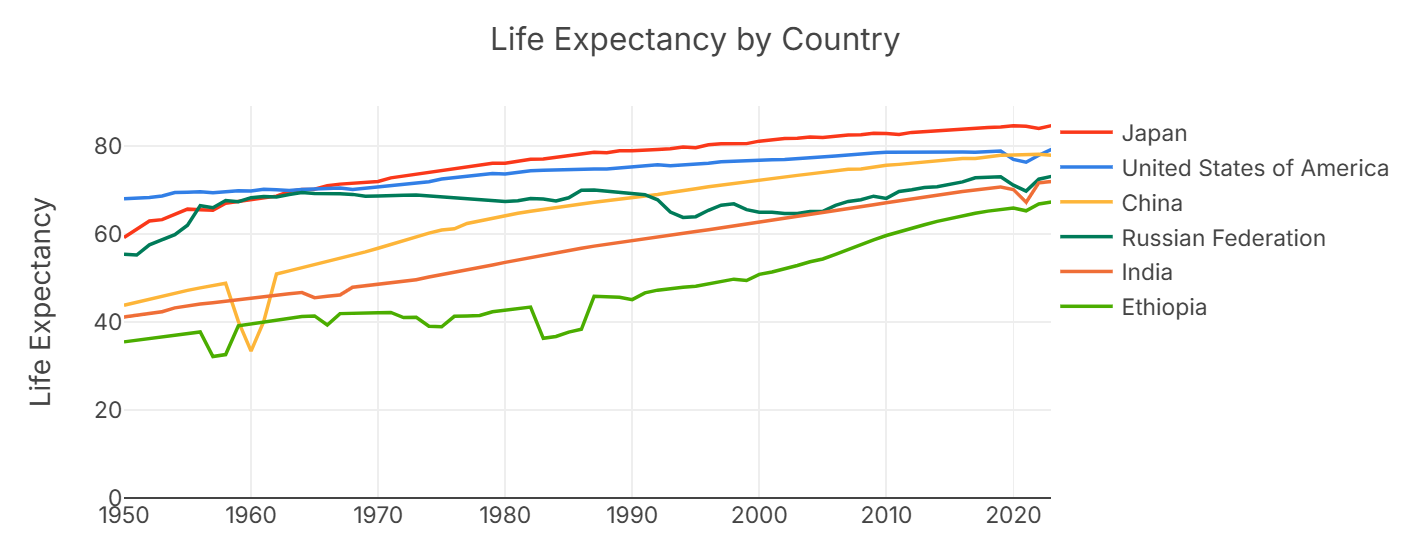
Visualize Global Demographic Trends
Within the Population Charts sheet you can easily chart global demographic statistics over time to identify global trends. In the chart below we examine the relationship between life expectancy and fertility. 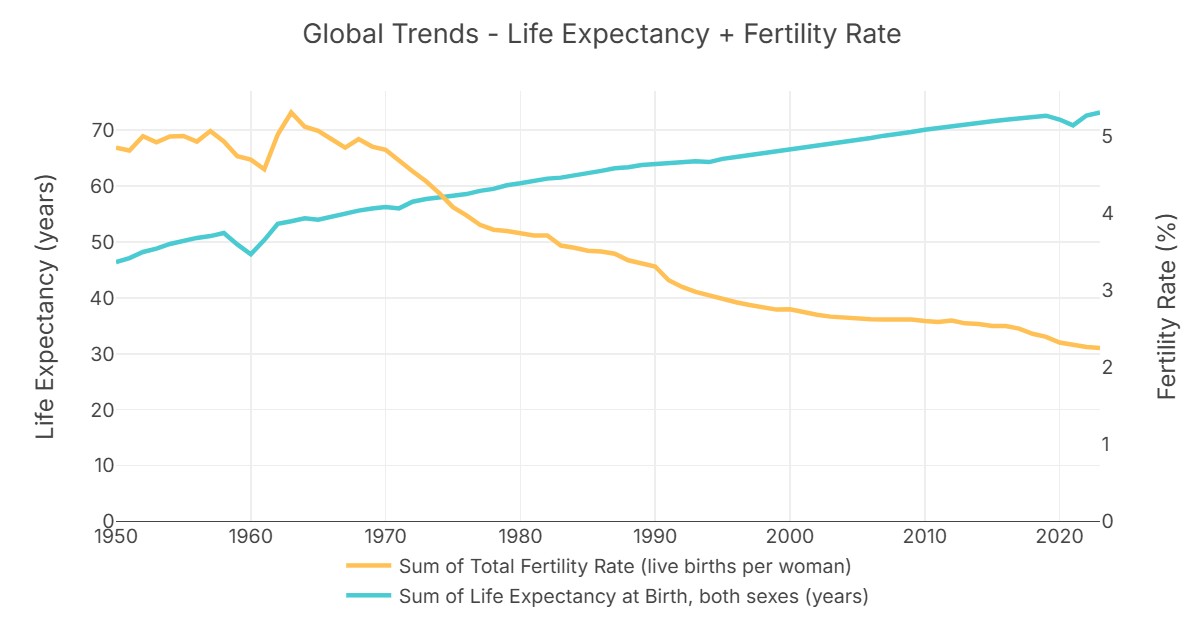
Analyze COVID Impact on Overall Death Rate
Charting the global mortality rate for people ages 15 to 60 reveals the COVID impact on global population. Overall death rates rose sharply during COVID, particularly in the United States. 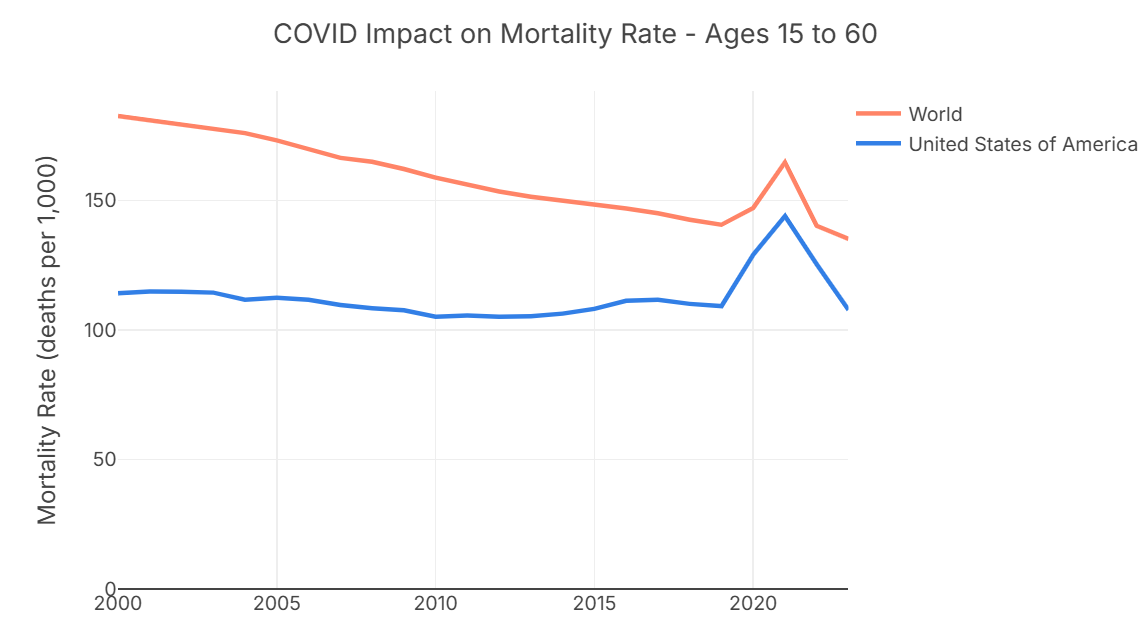
Highlights from the Dataset:
Here are a few country rankings and global population trends.
Most Populated Countries in the World:
- India - 1,438,069,596 (+11% in past 10 years)
- China - 1,422,584,933 (+3% in past 10 years)
- United States - 343,477,335 (+7% in past 10 years)
- Indonesia - 281,190,067 (+10% in past 10 years)
- Pakistan - 247,504,495 (+17% in past 10 years)
Fastest Growing Countries
- Qatar +46.6% in past 10 years to 2,979,082 people
- Jordan +43.1% in past 10 years to 11,439,213 people
- Somalia +42.7% in past 10 years to 18,358,615 people
- Niger +41.3% in past 10 years to 26,159,867 people
- Chad +41.1% in past 10 years to 19,319,064 people
Countries with the lowest birth rate and highest birth rate
Among countries with at least 10 million people:
- South Korea has the lowest birth rate at 0.72 births per woman
- Somalia has the highest birth rate at 6.1 births per woman
Countries with Longest Life Expectancy
- Monaco has the highest life expectancy at 86.4 years
- Japan has the highest life expectancy among countries with at least 10 million people with an average life expectancy at 84.7 years.
Countries with Shortest Life Expectancy
- Nigeria - 54.5 years
- Chad - 55.1 years
- Lesotho - 57.4 years
- Central African Republic - 57.4 years
- South Sudan - 57.6 years
Countries with the Highest Population Density
- Monaco is the most densely populated country with an average of 26,145 people per square kilometer and a total population of 39 thousand people.
- Bangladesh is the most densely populated country among countries with at least 10 million people with an average of 1,317 people per square kilometer and a total population of 171.5 million.
Countries with Lowest Population Density
- Greenland is the least densely populated country with an average of 0.14 people per square kilometer and a total population of 56 thousand people.
- Australia is the least densely populated country among countries with at least 10 million people with an average of 3.4 people per square kilometer and a total population of 26.5 million.
Forecast Largest Countries in 2100
Most populated countries in 2100 with change vs current population:
- India - 1,505,251,761 (+6% vs current)
- China - 633,368,113 (-56% vs current)
- Pakistan - 511,000,618 (+106% vs current)
- Nigeria - 476,747,781 (+109% vs current)
- Democratic Republic of the Congo - 430,709,445 (+307% vs current)
Note the dataset has various population growth scenarios. The above list reflects the "Medium" scenario.
Use Cases for this Dataset
Row Zero is 1000x more powerful than traditional spreadsheets and is built for big data, so you can easily import your data into the spreadsheet above to map your data (or vice versa) or just start exploring this comprehensive population dataset with charts and pivot tables. Here are a few common use cases:
- Lookup population by country and filter, sort, and pivot to quickly analyze the data.
- Rank countries by demographic measures like life expectancy, infant mortality, etc.
- Visualize global demographic trends and chart global population by country over time.
- Calculate market penetration by country. The dataset includes ISO2 and ISO3 codes for each country as well as mapping to country names in Google Analytics data exports.
- Enrich your current datasets with population data. You can use XLOOKUP to join datasets or import population data directly to your data warehouse.
Data Sources
The primary data source for this global population dataset is the United Nations Department of Economic and Social Affairs. Data has been updated as of February 2025 with the most recent data available.