Row Zero makes it easy to calculate market penetration by any location type. Row Zero is a next-gen spreadsheet 1000x more powerful than traditional spreadsheets so you can analyze large datasets easily. We've created a free spreadsheet with population data for all U.S. locations (ZIP, town, county, metro, state) and all countries worldwide. Simply import your data into this spreadsheet (or vice versa) and use COUNTIF or XLOOKUP to connect the data and calculate geographic penetration by location. You can also import this population dataset into your database or data warehouse to enrich all of your customer data.
Open Population by Location Spreadsheet
- Population by location dataset
- How to calculate market penetration
- Example 1: Calculate market penetration with customer lists or sales data
- Example 2: Calculate market penetration with Google Analytics Data
- Example 3: Calculate market penetration with IP address data
- Example 4: Import population data into your database or data warehouse
- Troubleshooting calculating geographic penetration
Population by location dataset
View Spreadsheet
The population dataset is sourced from the U.S. Census and United Nations datasets and imported and curated in a Row Zero spreadsheet. It includes population and demographic data for every location in the United States (ZIP, town, county, metro, state, and U.S. congressional district) and every country globally. Row Zero works like Excel and Google Sheets, but is significantly more powerful, so you can easily import large public datasets and combine with your own large datasets to make big data analysis easy.
Data source detail: U.S. population data is from the U.S. Census Bureau. The data is typically 5-year estimate tables from the American Community Survey. Global population is from the United Nations Department of Economic and Social Affairs. Data has been updated as of February 2025 with the most recent data available and population statistics are estimates provided by these sources.
You can also explore more detailed demographic breakdowns by location including age, gender, race, income, and population change on our free public datasets page.
How to calculate market penetration by location
You can calculate geographic penetration by country, state, metro, county, ZIP, etc., by importing your dataset into the population spreadsheets (or vice versa) and using XLOOKUP or COUNTIF to get 4 columns:
- Column 1: List of all locations
- Column 2: Count of your customers in each location
- Column 3: Total population in each location
- Column 4: Divide customer count by total population for each location
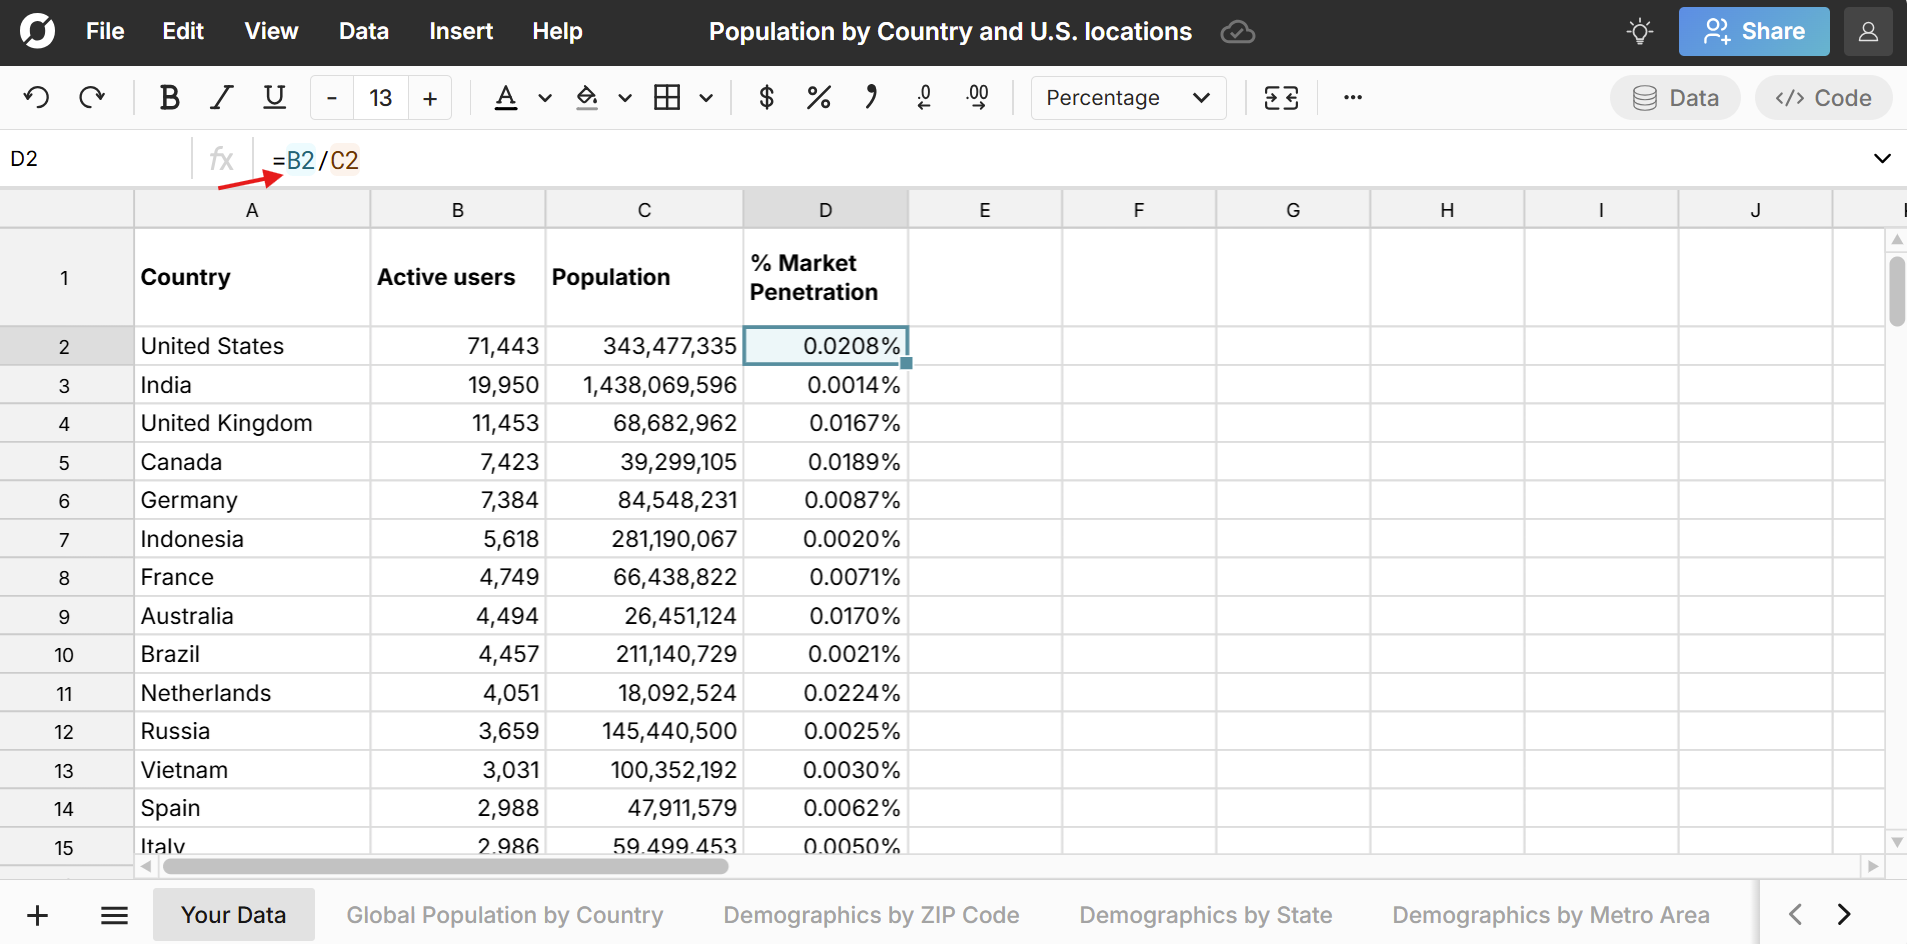
Column 4 is your market penetration by location. You can sort and filter this column or create a pivot table or chart to analyze your market penetration to find opportunities and identify market saturation. If you want to do a more advanced market penetration calculation you can segment both the customer counts and population counts by cohorts like gender, age, income, education level, etc. You can find detailed demographic breakdowns on our free public datasets page.
Note: If your dataset is counts by location, you'll use XLOOKUP to calculate market penetration. If your dataset is row-by-row customer data, then you'll use COUNTIF to calculate market penetration. In either case, you'll need to ensure that the locations in your dataset exactly match the locations in the population spreadsheets. The population spreadsheets include standard codes for each location (FIPS codes for U.S. locations and ISO codes for countries) to make this easy. We've also included mapping to Google Analytics locations.
Example 1 - Use COUNTIFS to calculate market penetration with customer lists or sales data
If your data is row level data (i.e. 1 row for each customer), you can use COUNTIF to calculate counts of your data by location in the existing location population sheets. Here's an example for market penetration by ZIP Code:
- Import your customer list into the population spreadsheet (or vice versa).
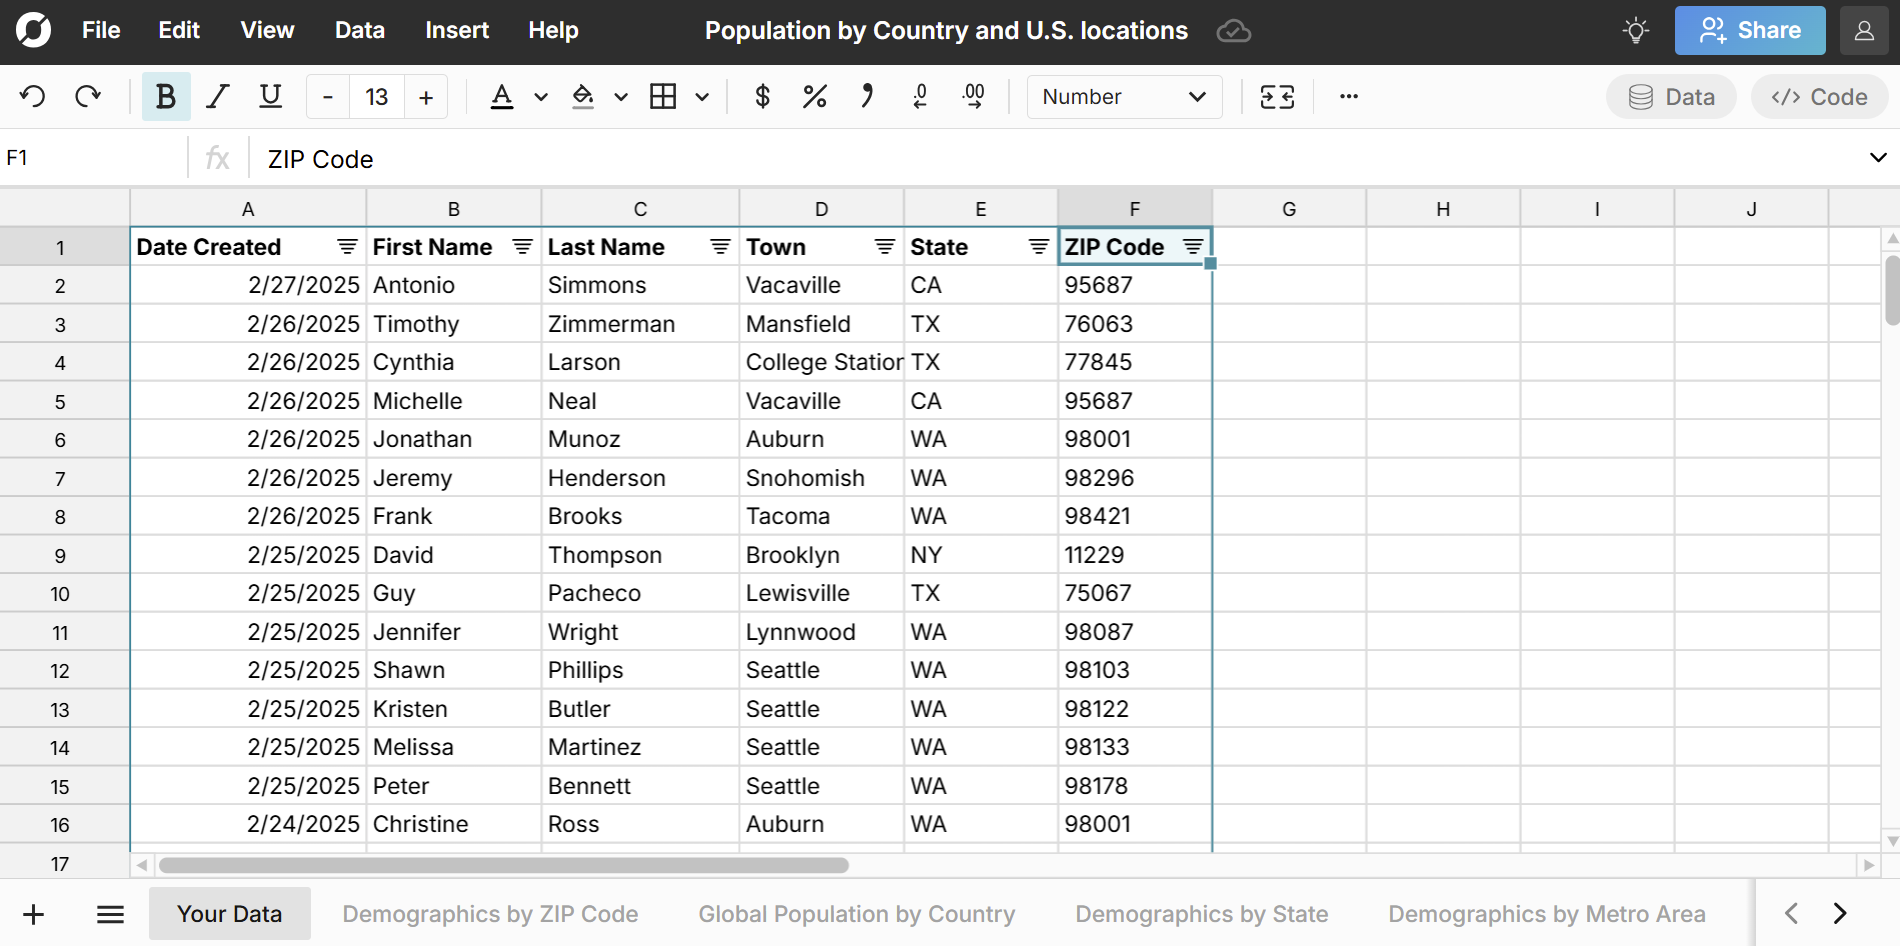
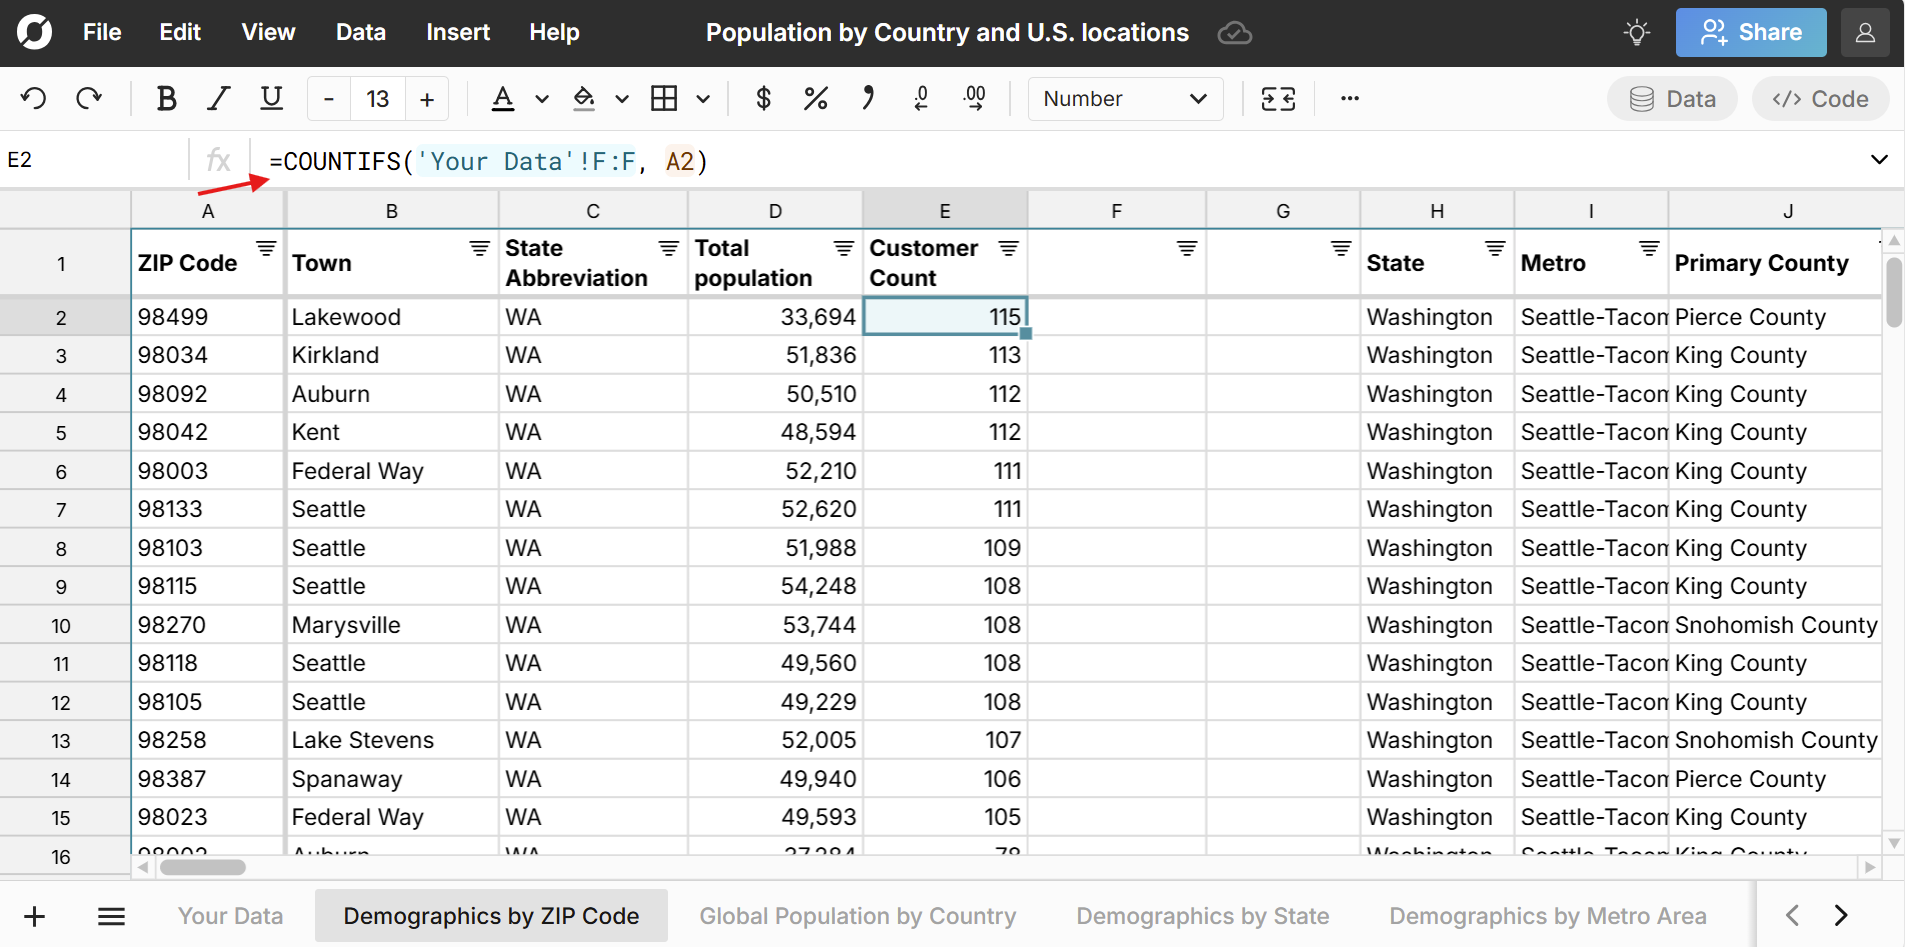
- Create a new column in the ZIP code population sheet to calculate the number of customers by ZIP code and write a COUNTIF formula - for criteria range, select the column in your dataset that has customer ZIP codes, and for criteria select the first cell with the first ZIP code in the ZIP code population sheet. Fill your formula down your column by double clicking the bottom right corner of the cell or dragging down.
- In the next column, divide this new column of customers by ZIP code by the actual population of each ZIP Code. This gives you your market penetration by ZIP code.
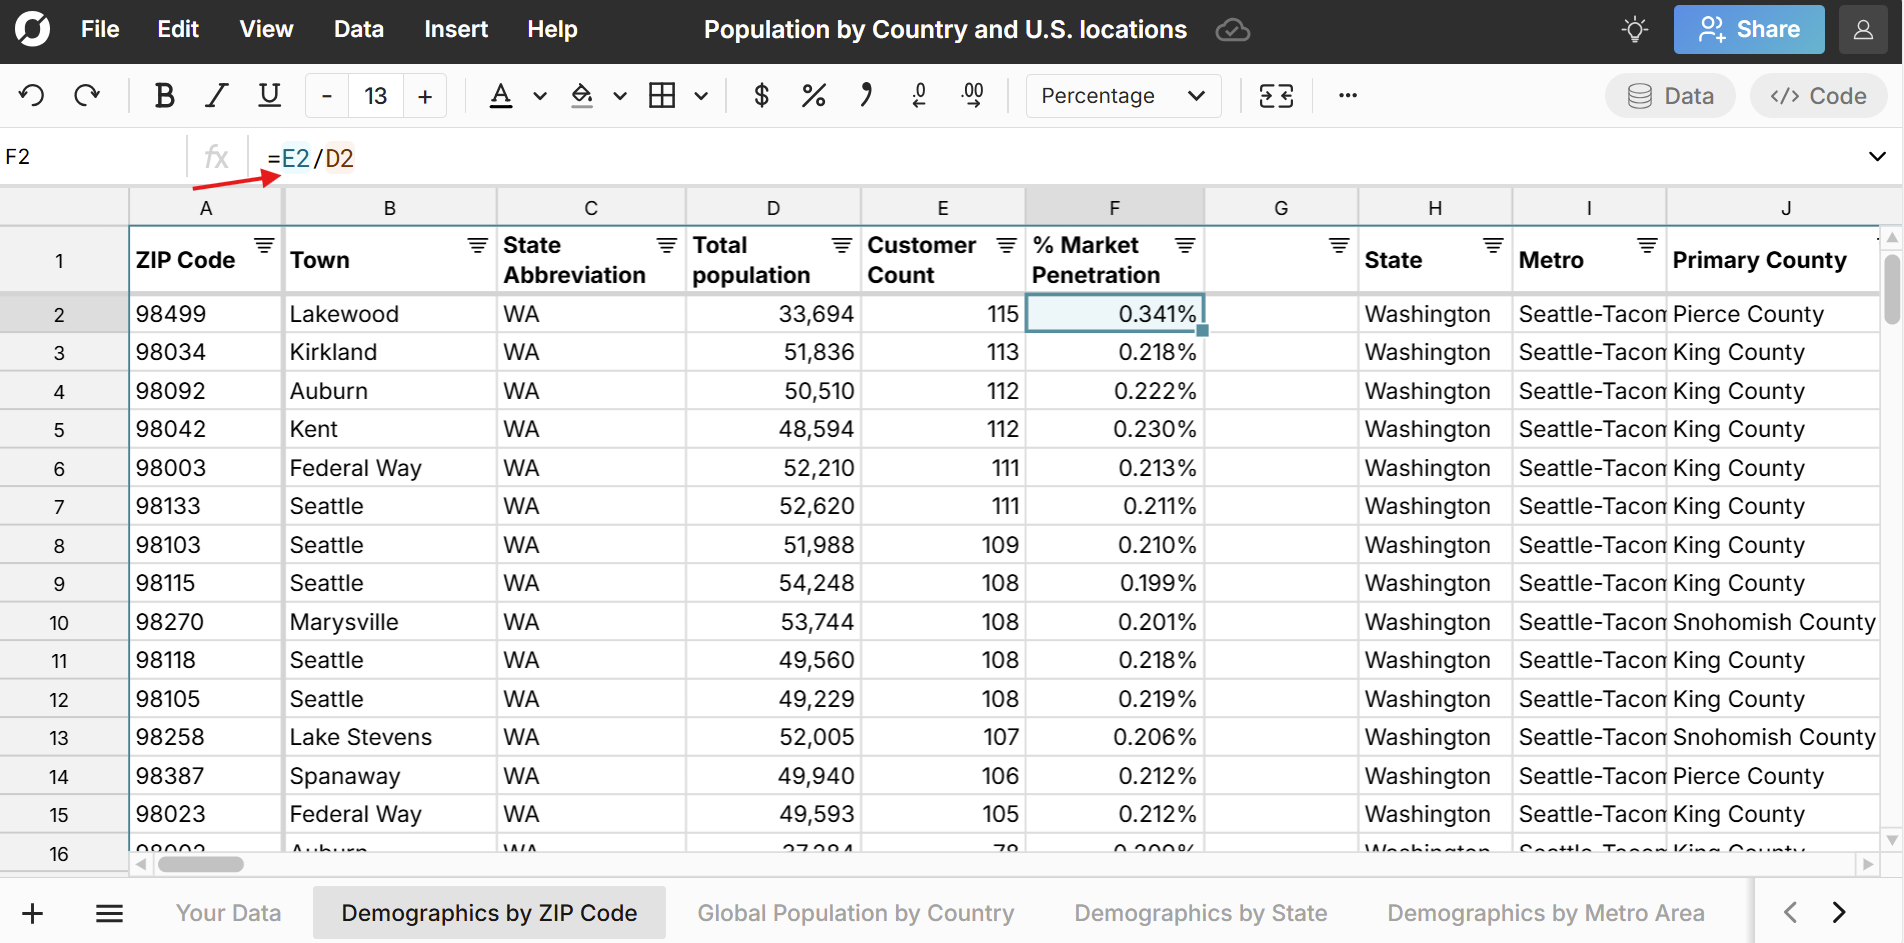
- You can format to percentages, filter, and sort to explore the data and find ZIP codes with the highest market penetration.
Note: Make sure your customer list only has one row per customer. If it has multiple rows for some customers, you can use remove duplicates to ensure a unique customer count and accurate market penetration rate.
You can take the same approach as above to calculate advanced market penetration by segments like age, gender, race, and income.
Example 2 - Calculate market penetration with Google Analytics Data
This is an example where the customer data is in counts by location and we use XLOOKUP to calculate market penetration.
Google Analytics lets you drill down to geography to see how many unique visitors you have over a given time frame by location. You can aggregate data by country, metro area, and state. You can import this data into the population spreadsheet to calculate market penetration in each of these location types. Here's how:
- Go to your Google Analytics and drill down to the specific geography type you want to analyze. Typically you can find this by going to User, User Attributes, Demographic Details.
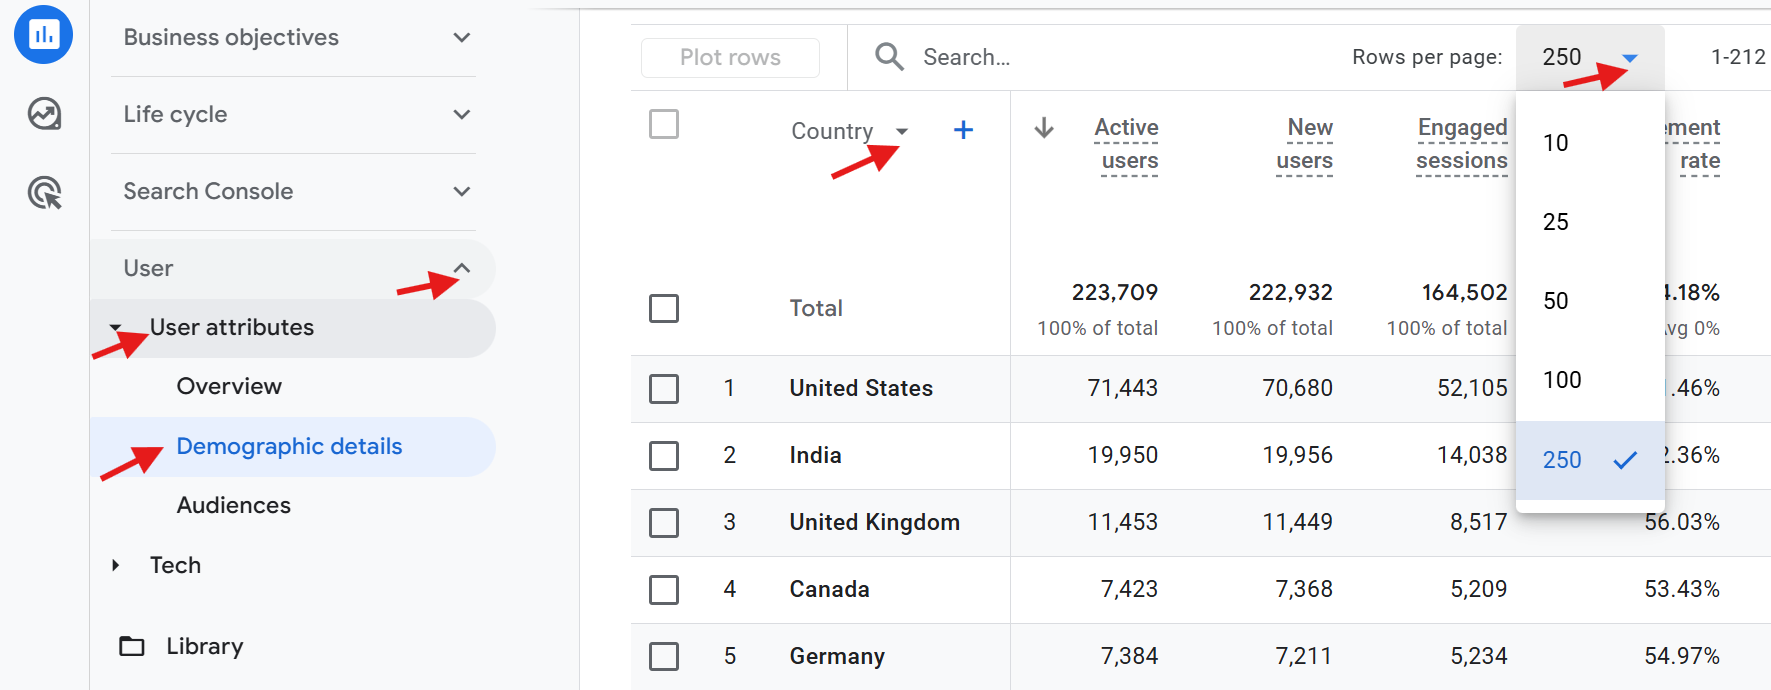 Be sure to expand the selection to the largest number of rows and then click Export and select CSV.
- Open the population dataset spreadsheet in Row Zero.
- Import your Google Analytics CSV by going to Data, Import from file. In the file preview, be sure to select New Sheet as the destination.
- Create a new column in your Google Analytics sheet for total population and write an XLOOKUP formula - for key, select the first location you want to map, for lookup range, select the corresponding location column in the population dataset, and for return range, select the corresponding population column in the population dataset. Hit enter and then fill your formula down your column by double clicking the bottom right corner of the cell or dragging down.
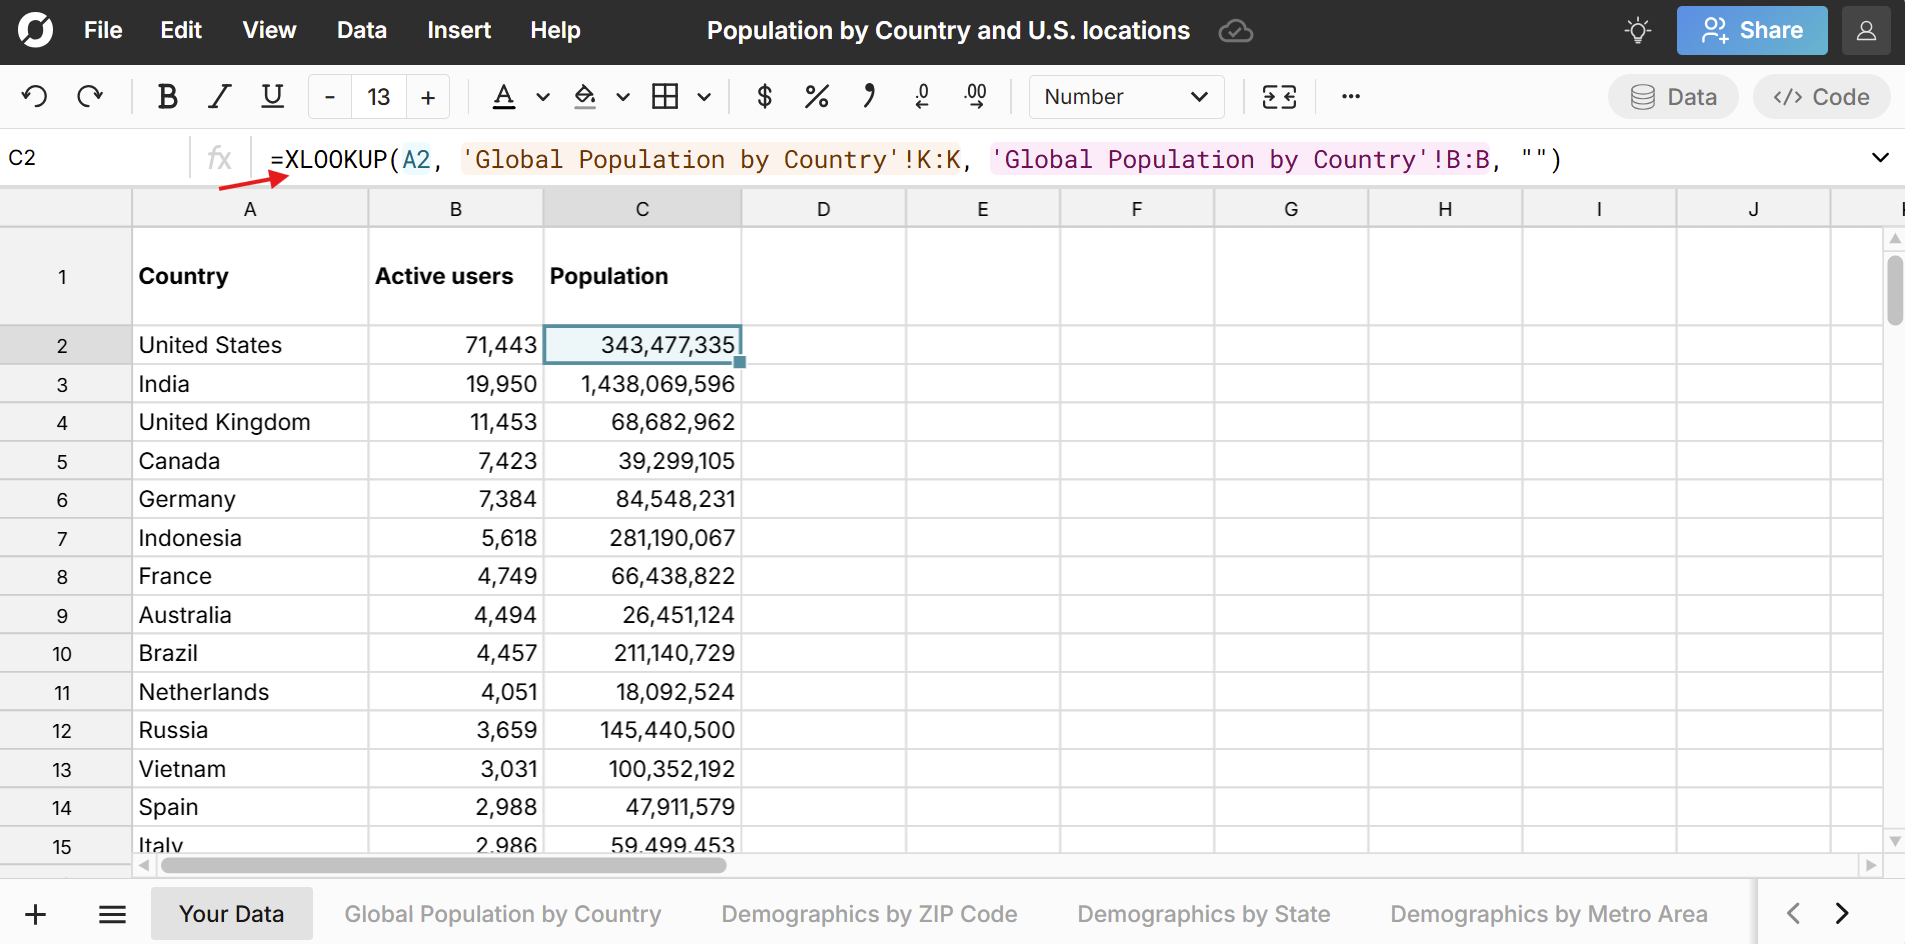
- In the next column divide your customer count column by this new column of total population. This gives you your market penetration by country.

- You can format to percentages, filter, and sort to explore the data and find countries with the highest market penetration to see where your website is over or underperforming geographically.
Here's a video tutorial for calculating market penetration with Google Analytics data:
Note: We've done the work to map Google Analytics locations to their corresponding locations in the population dataset. If you're sourcing data from a different source, you'll want to make sure that locations and their formats align in both your data source and the population spreadsheet.
Example 3 - Calculate market penetration with IP address data
Here are steps to map your IP addresses to locations and calculate market penetration. Row Zero is a good tool for this analysis - the big data power can handle large IP address databases (millions of rows) and the built-in Python feature makes it easy to convert IP addresses to integers.
Step 1: Import your IP address data into the population sheet
Open the population spreadsheet and import your IP address data into a new sheet.
Step 2: Convert IP addresses to integers
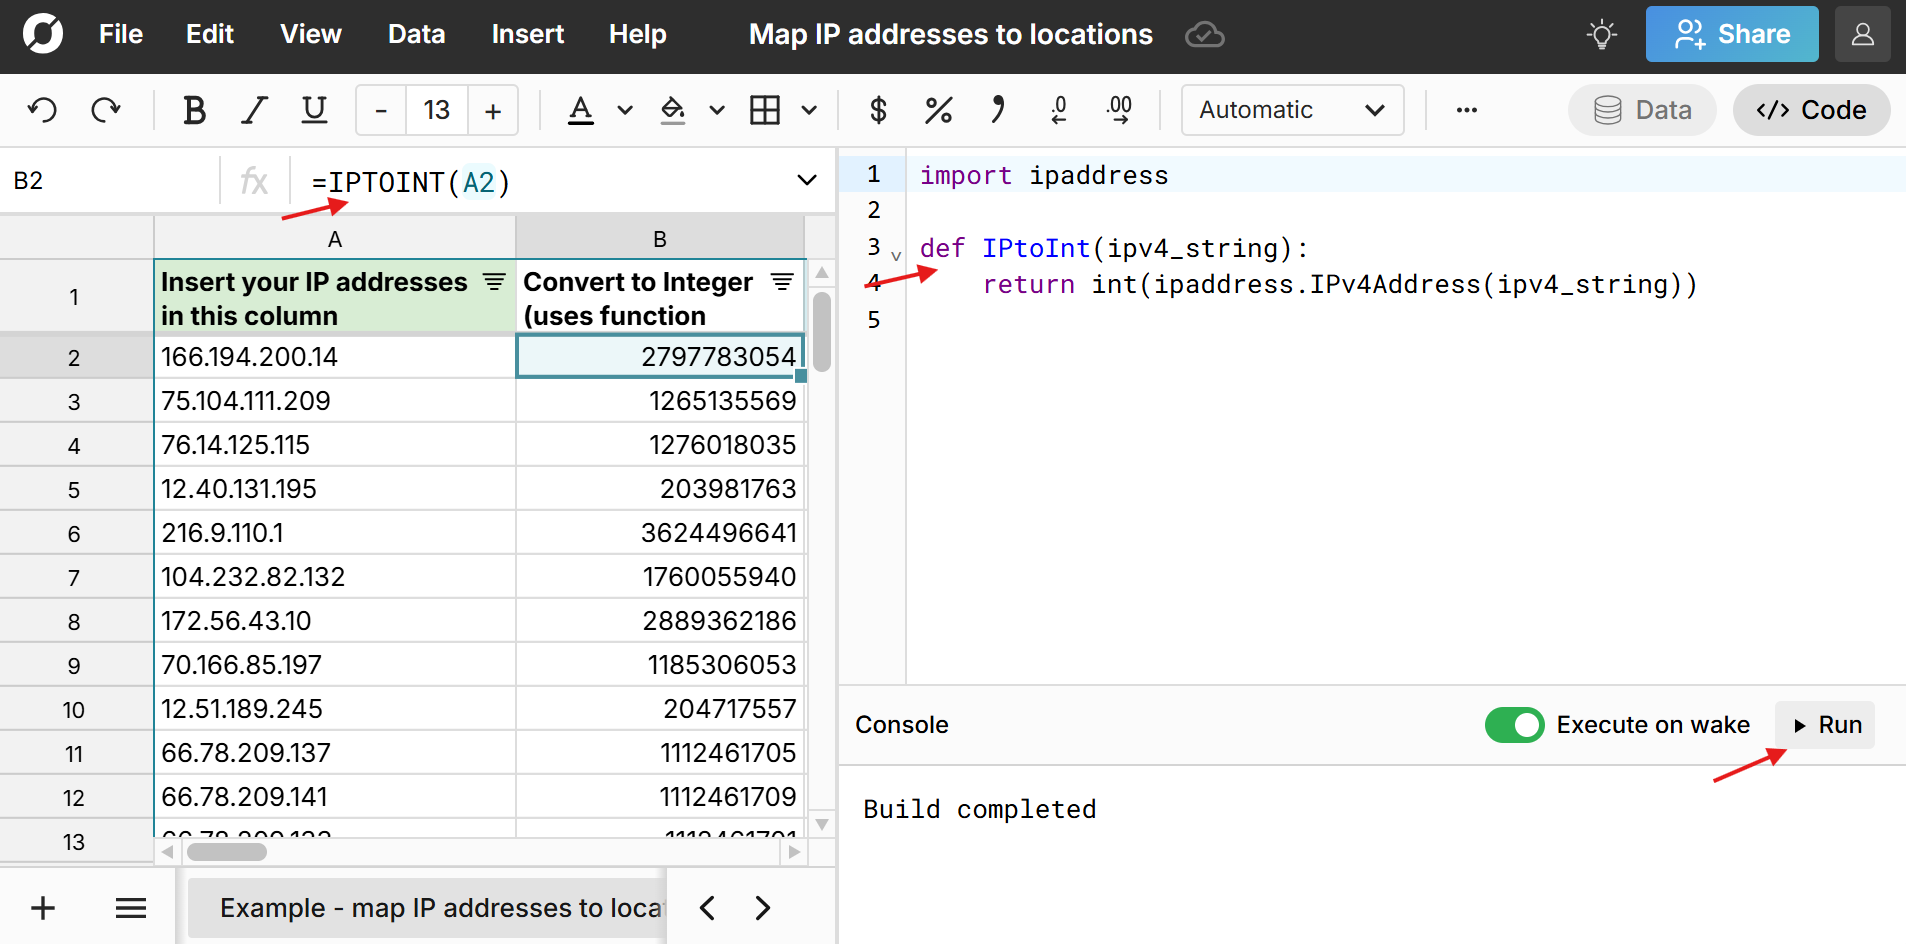
To map your IP addresses to locations, you'll need to convert your IP addresses to integers to be able to bulk lookup IP address locations. We can use Row Zero's built-in python code window to create a simple function to convert IP address to integer.
import ipaddress
def IPtoInt(ipv4_string):
    return int(ipaddress.IPv4Address(ipv4_string))
Step 3: Import IP address database
Next we need to import an IP address location dataset into our spreadsheet. There are a number of free IP address databases you can choose from and Row Zero is uniquely powerful enough to import them (they're typically millions of rows). Here are two free IP address to location datasets to try: IP to ASN database or dbipcity database. If possible, import an IP address database with IP addresses already in number format. If not, you can simply convert the IP addresses to numbers using the same process in step 2.
Step 4: Lookup IP address locations with XLOOKUP
In a new column next to your list of IP addresses, use XLOOKUP to lookup each IP address's location data. Depending on the IP address database you choose, you can look up country, state, city, latitude, longitude, etc. 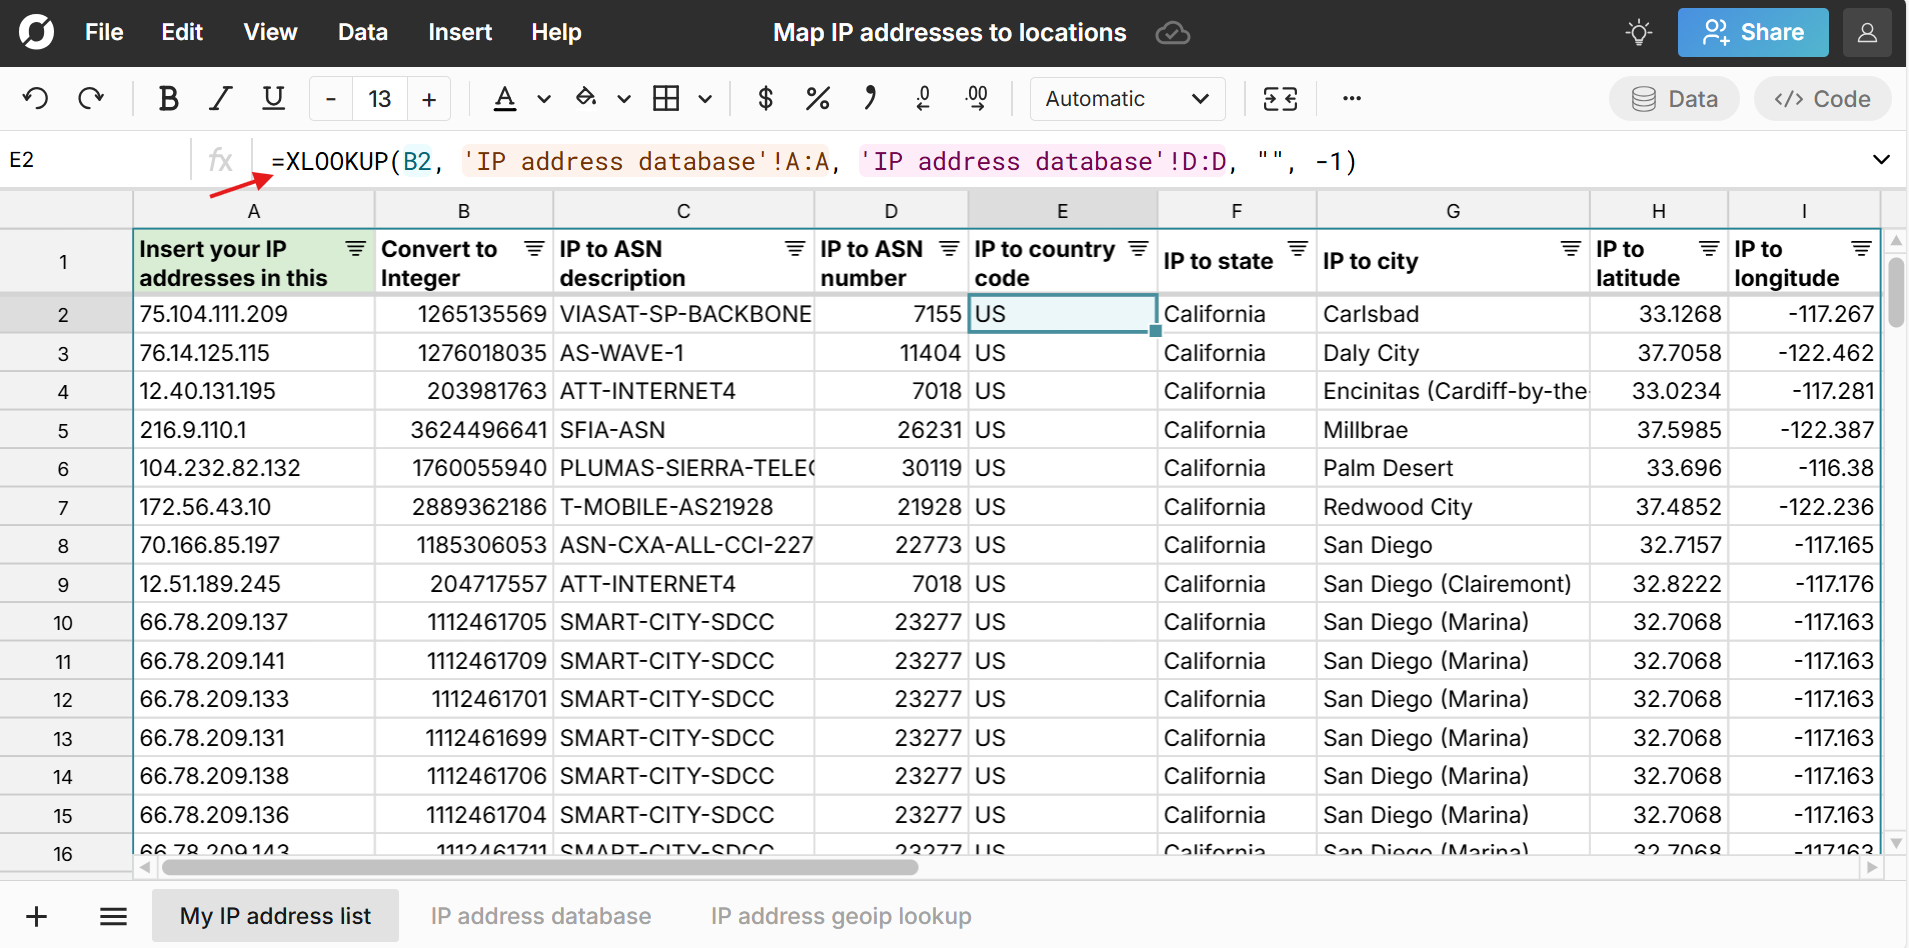
Step 5: Calculate counts by location
In the population sheet, insert a new column and write a COUNTIF formula - for criteria range, select the column in your dataset that has the IP address location, and for criteria select the first cell with the first corresponding location in the population sheet. In this case we use the ISO 2 code for each country. 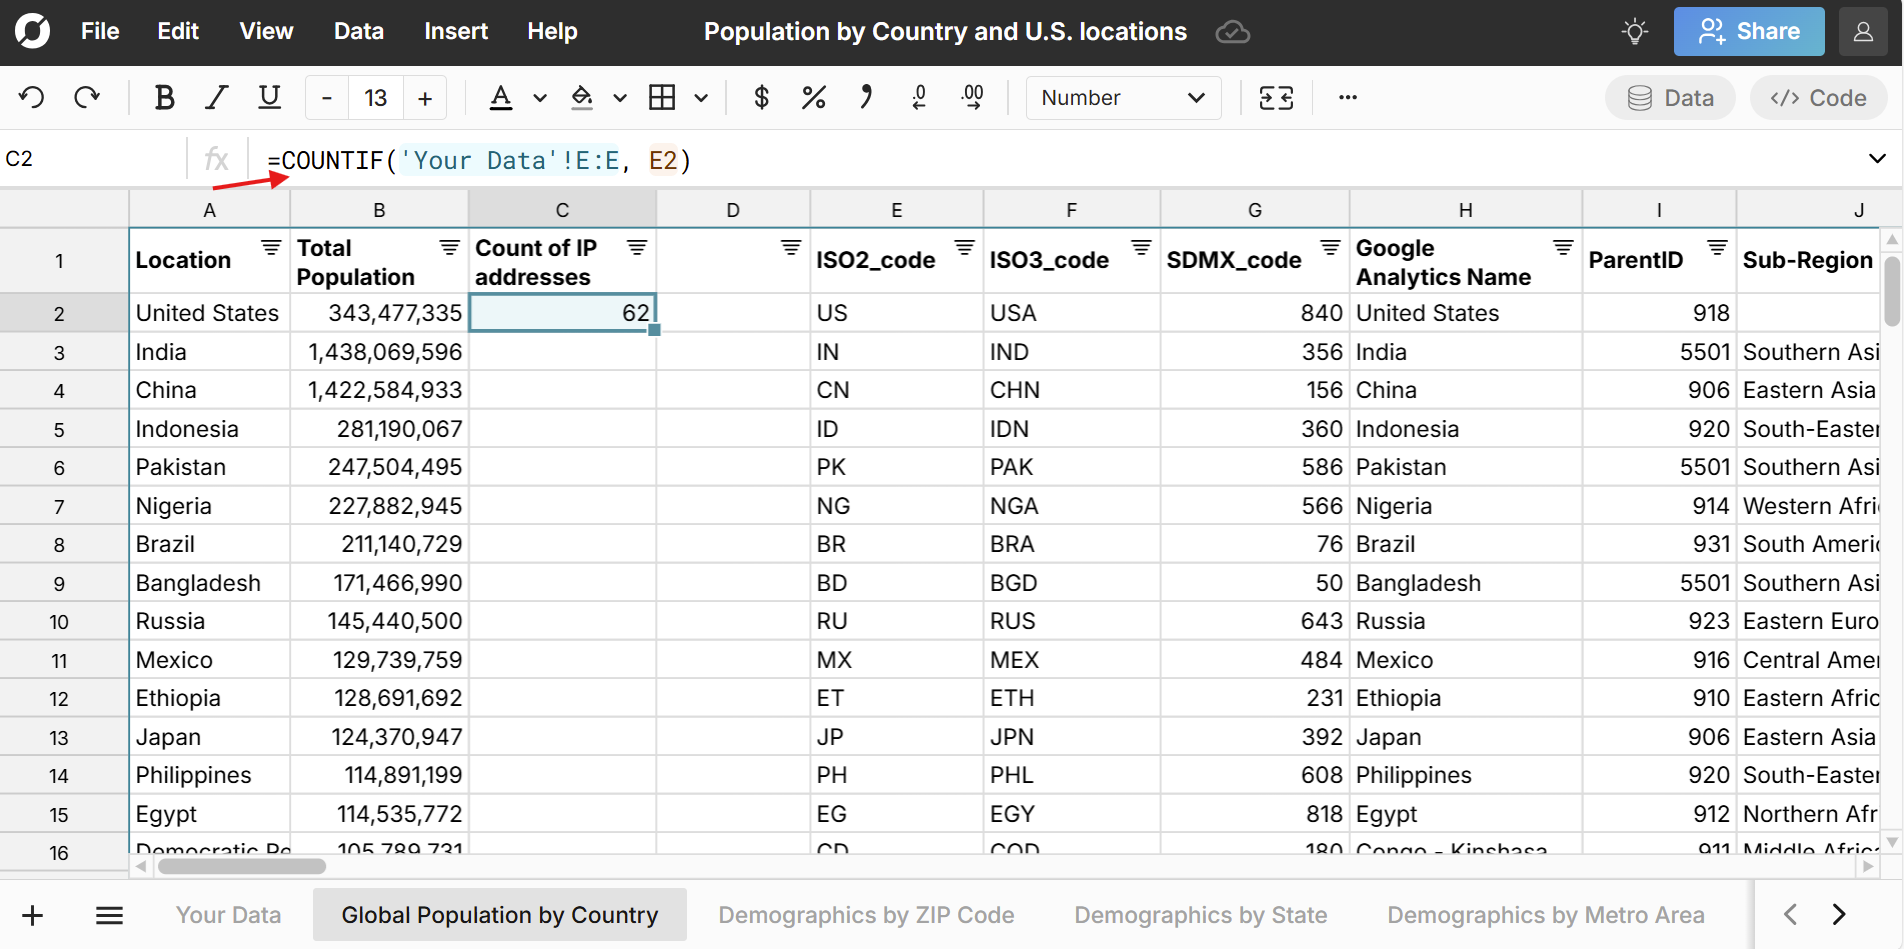
Step 6: Calculate market penetration (or ratio of customer traction by location)
In the next column, divide this new column of customers by location by the actual population of each location. This gives you your market penetration using IP addresses.
Note: One user can be tagged with several IP addresses in your data, especially if they're accessing your application on the go in free wifi, hotspots, etc. Users will also likely have several instances of using your application from the same IP address. Depending on your goals and dataset, you may want to limit each user to one row with their most used IP address. Otherwise, your data will likely show skewed results and you may see high traffic public areas like airports showing a lot of activity. Conversely, you could include every instance of every IP address for every user and you would still probably get useful market traction data, especially at the country level.
If you need more help, here is a post showing how to lookup IP address locations using Row Zero.
Example 4: Import population data to your data warehouse
You can use Row Zero to enrich your data warehouse with population by ZIP code, state, country, etc. Row Zero free plans allow you to connect your data warehouse to these population spreadsheets (or any spreadsheet) to import data to spreadsheets. Row Zero paid plans support write-back to your database or data warehouse, so you can import population data.
To export to your data warehouse, simply select the data in the sheet, right click, and select Export to and follow the instructions. 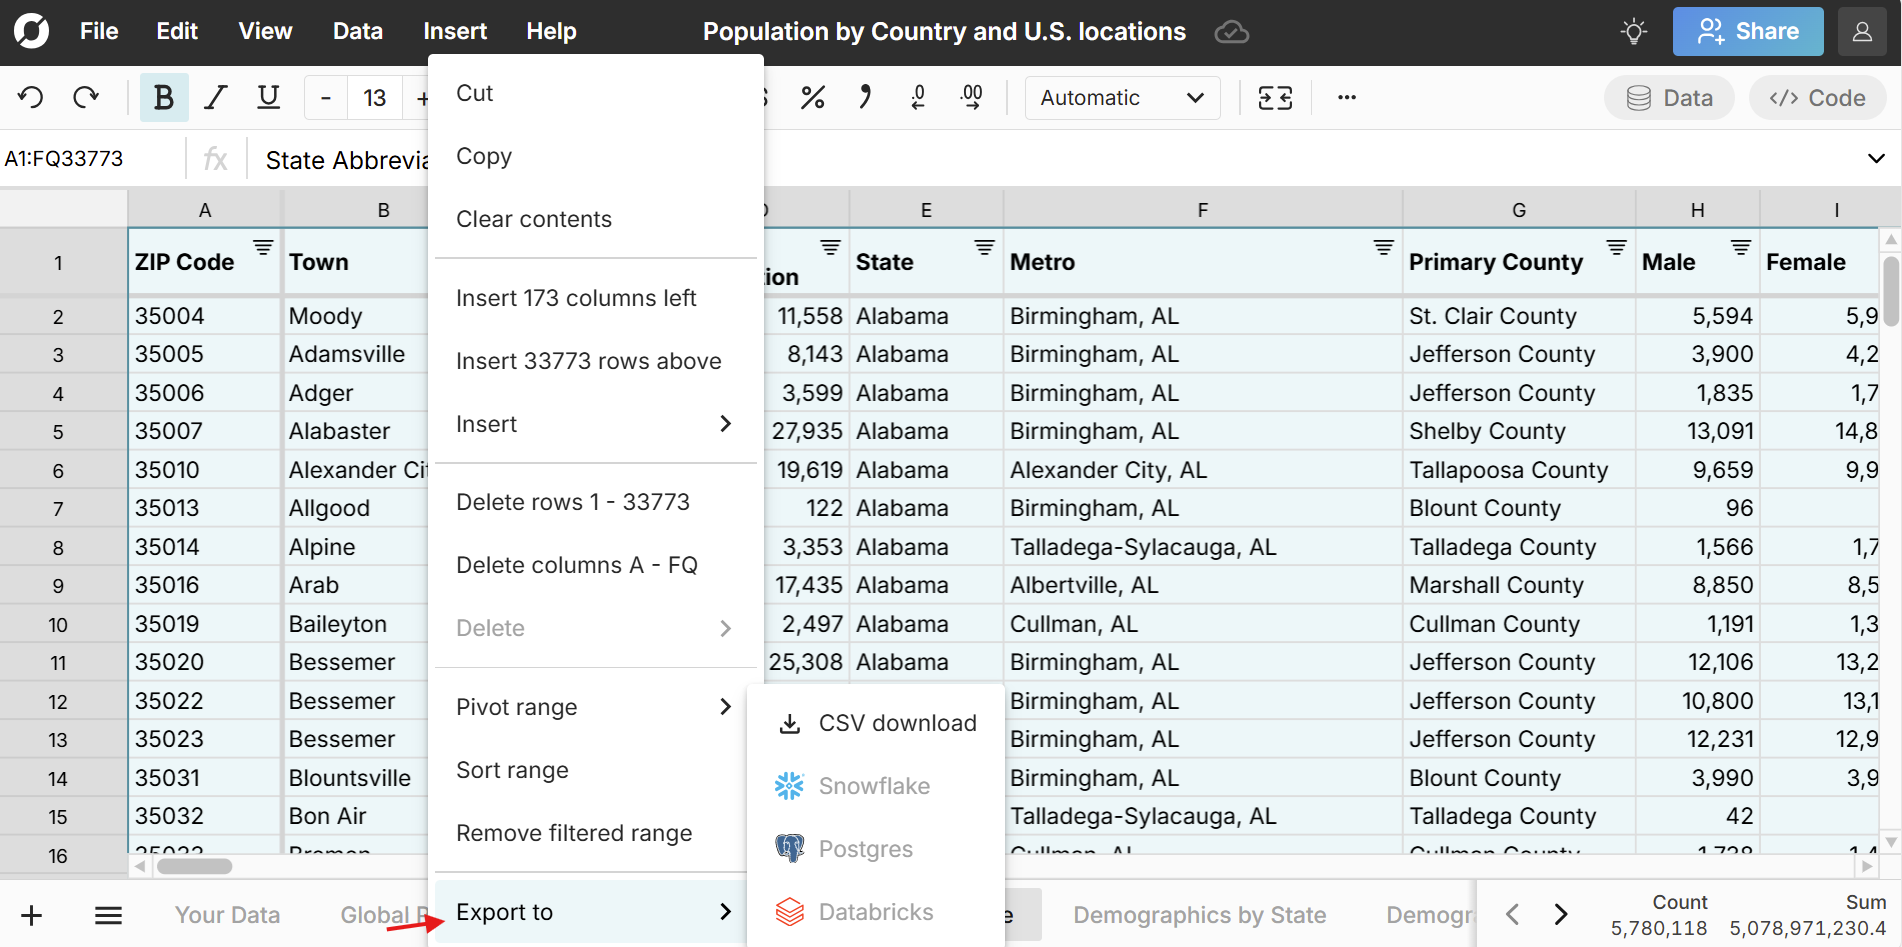
Here's more detail on how to connect Row Zero to popular data sources: Postgres, Snowflake, Databricks, BigQuery, and Redshift.
Troubleshooting calculating geographic penetration
Location mapping
Mapping locations using COUNTIFS and XLOOKUP requires that locations in your dataset exactly match the locations in the population spreadsheets. For example, "Boston, MA" will map to "Boston, MA" but not "Boston-MA". Similarly, the values must be the same data type. For example, your ZIP code should be in text format (instead of number) in both locations to ensure an accurate mapping. When possible, try to map location data using standard codes like FIPS codes for U.S. locations and ISO codes for countries. The Row Zero population spreadsheets include these standard location codes.
Data too big for Excel and Google sheets
It can be a challenge to work with large population datasets in Excel or Google Sheets, especially when joining with other datasets. The Excel max row limit is 1,048,576 and will slow down well before that. Google Sheets limits are similar. Row Zero is 1000x more powerful than traditional spreadsheets and is a good alternative to Excel and Google Sheets for big data sets.
Open free population spreadsheet