Pivot tables offer an easy way to summarize data by date in a spreadsheet. You can easily make a pivot table group by month, week, quarter, etc. and group dates in columns or rows. Apply date groupings to any calculation - count, count unique, sum, average, min, max, etc.
This quick guide shows how to create a pivot table that groups datetimes by day, week, month, etc. across three popular spreadsheet apps - Row Zero, Google Sheets, and Excel and shows why Row Zero is the best way to group by date in a spreadsheet. Jump to specific sections using the links below or continue reading for the full guide.
How to Group by Dates in Pivot Tables
- Row Zero: Best way to group by dates
- Google Sheets: Create pivot date group
- Excel: Pivot table group by month, quarter, year
1. Best way to group by dates: Row Zero
Row Zero is a next-gen spreadsheet built for big data that makes it easy to summarize big datasets by date. You can group by any date and time level from seconds to days to years. Create connected spreadsheets that automatically update with the latest data to automate daily dashboards, weekly reviews, and monthly reports.
How to group pivot table dates in rows
- Open a workbook and import your data: Login or sign up for free, open a new workbook, and import data via file or dynamic data connection.
- Create a pivot table: Select your data and go to Insert, Pivot table.
- Drag date field to rows and select your date grouping: Row Zero pivot tables group dates and times to any level - second, minute, hour, day, week, month, quarter, year.
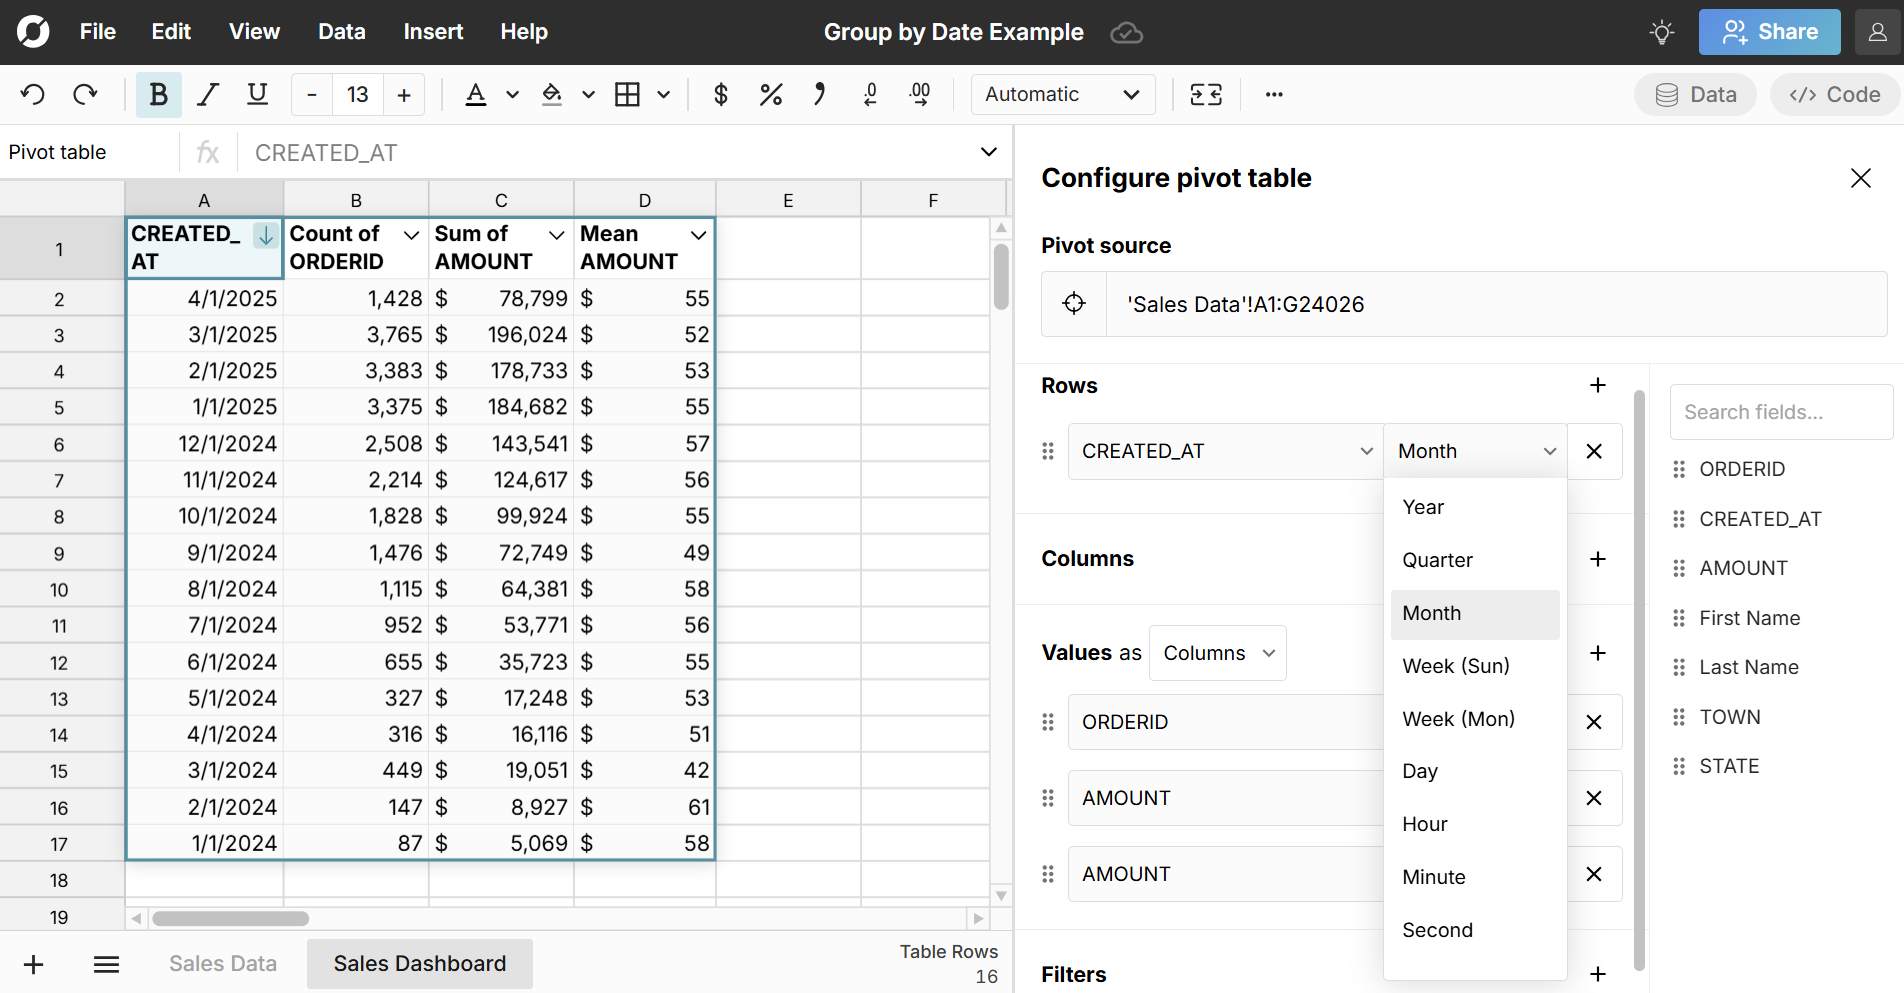 Complete your pivot table by dragging the relevant fields to columns and/or values. You can apply any value calculation to your date groupings. For example, you can sum sales by quarter, count unique customers by month, or calculate average order size by week.
You can easily change from one date grouping to another (e.g. month to week) and everything connected to your pivot table automatically updates including charts, formulas, and cascaded pivot tables. 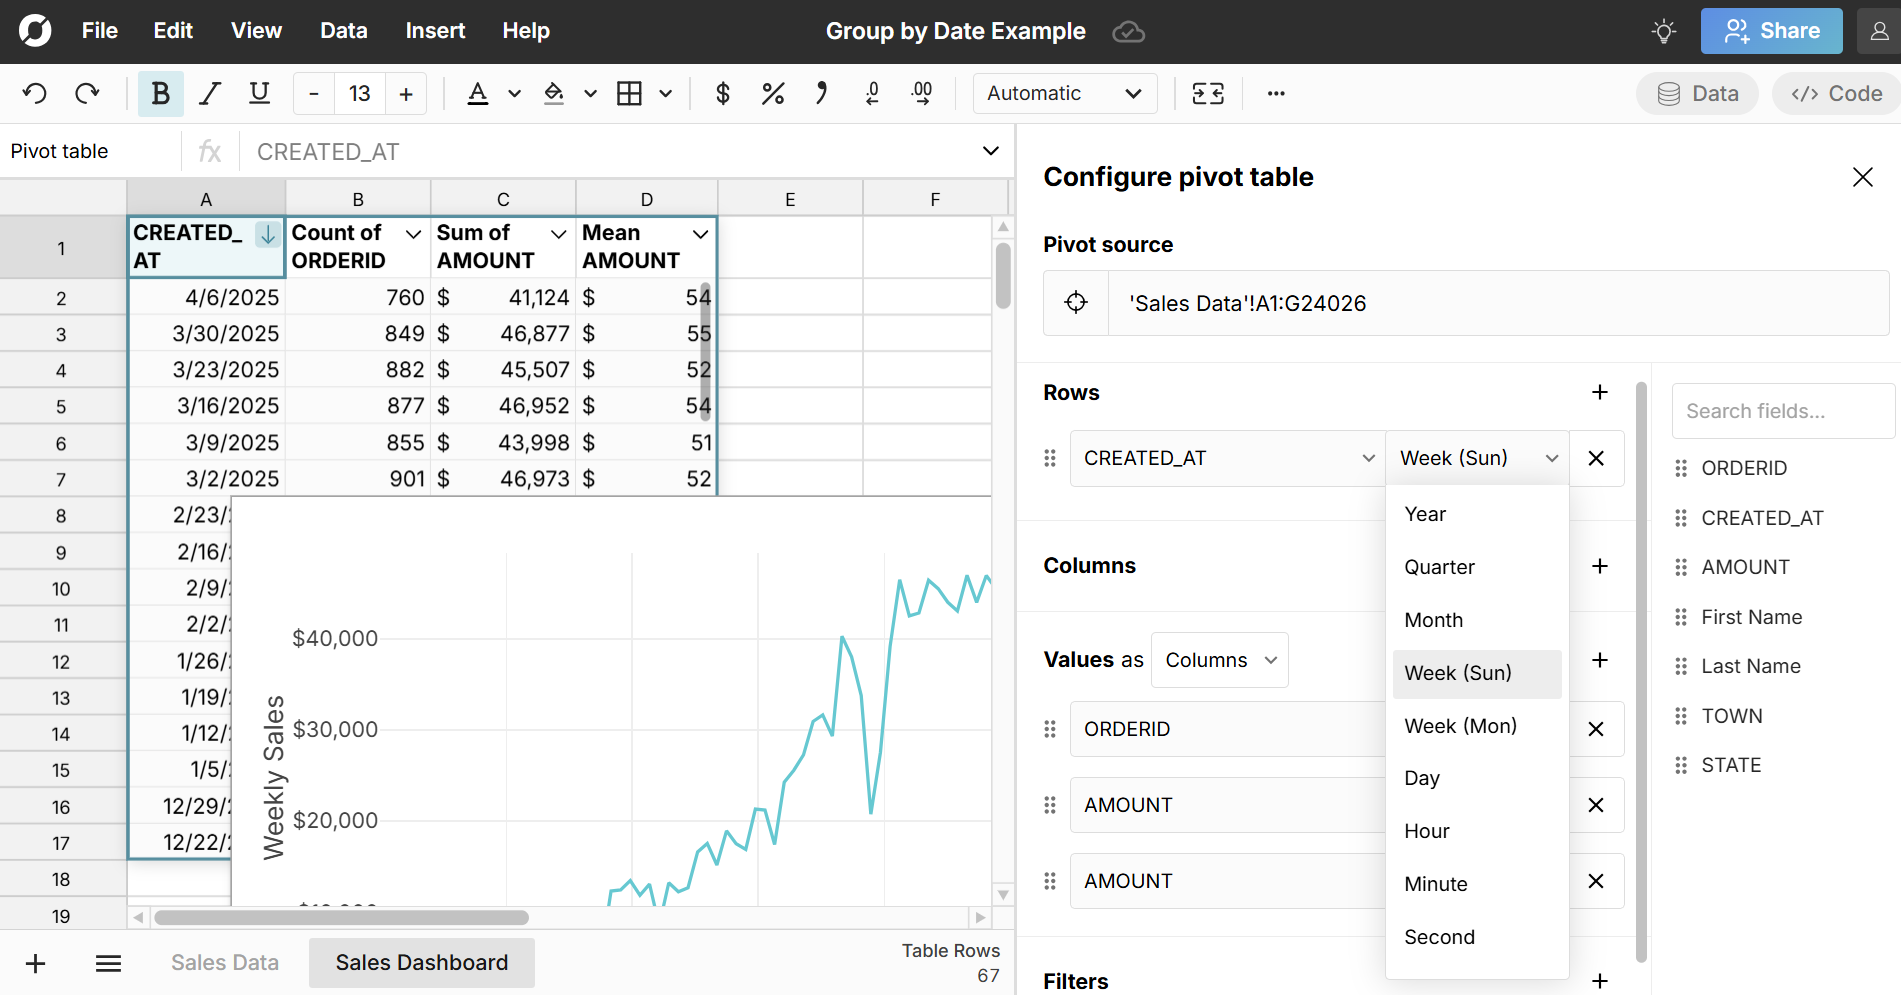
Here is a live example of pivot table group by date so you can see exactly how it works and here is a step-by-step video on how to group by dates in a pivot table:
How to group pivot table columns by month, week, etc.
Follow the same steps as above, but drag your date field to columns instead of rows:
- Open a workbook and import your data
- Create a pivot table
- Drag date field to columns and select your date grouping: Just like rows, you can group pivot table columns by any date level.
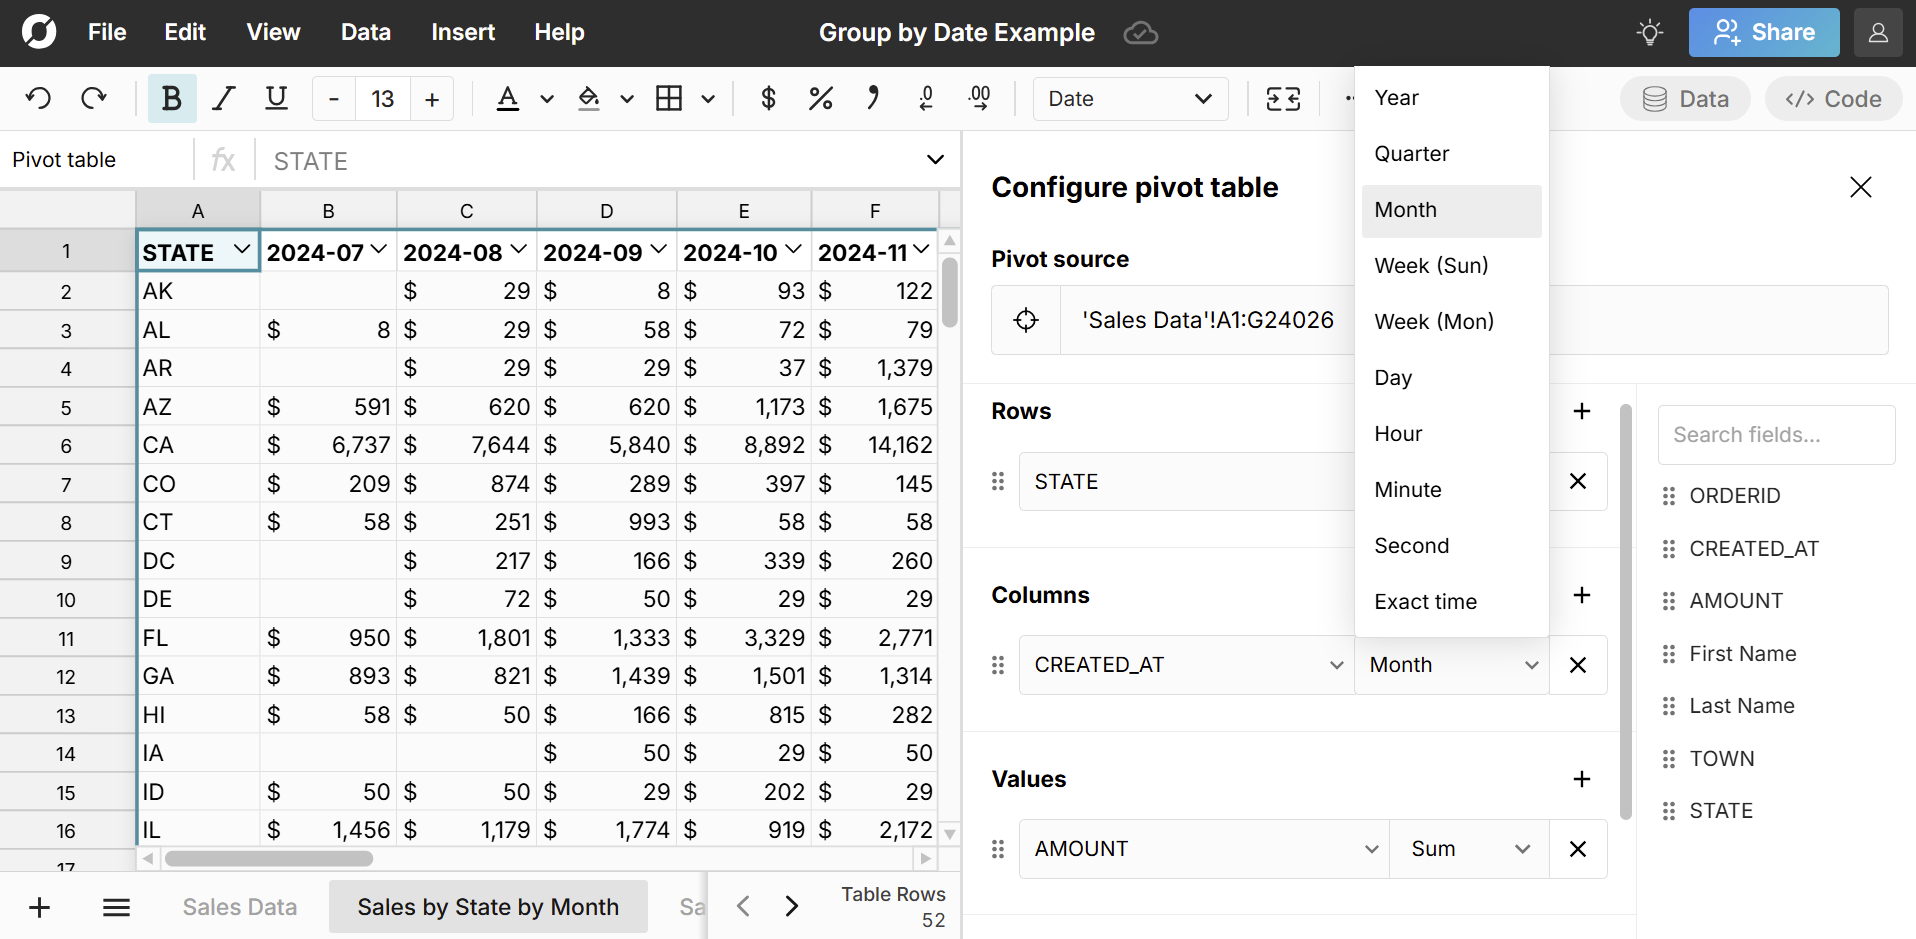
This is where Row Zero's big data power shines. While Excel and Google Sheets can only group dates in pivot table columns for datasets under ~20K rows, Row Zero makes it easy to group millions of rows of data into pivot table column groupings by month, quarter, etc. If you want to reduce the number of columns, just add a pivot table date filter.
Here is a live example of how to group pivot table columns by date so you can see exactly how it works.
How to automatically update date groupings
Row Zero is a connected spreadsheet. You can connect directly to your data source, build out your spreadsheet, and schedule auto updates. Any time your source data updates, everything referencing it also updates including pivot tables, charts, and formulas. This makes it very easy to automate recurring reports like weekly business reviews, KPI dashboards, etc. 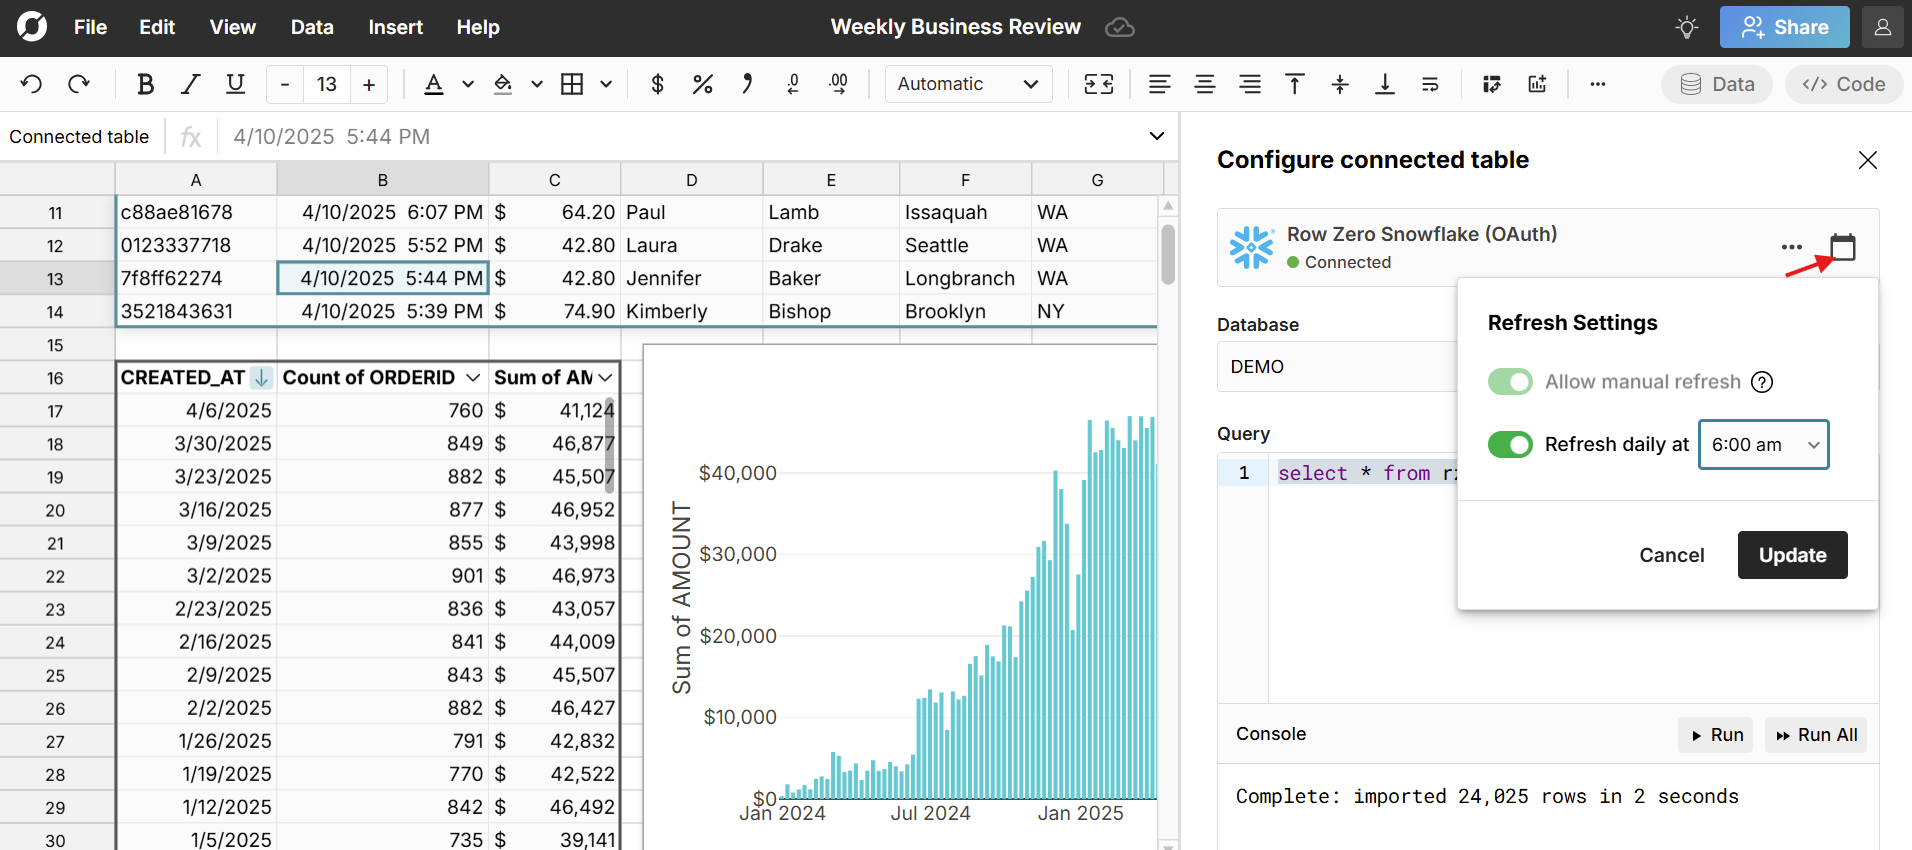 To schedule auto-updates, click the calendar icon in the connected table editor and select a time. Here's more information about how to create auto-updating spreadsheets.
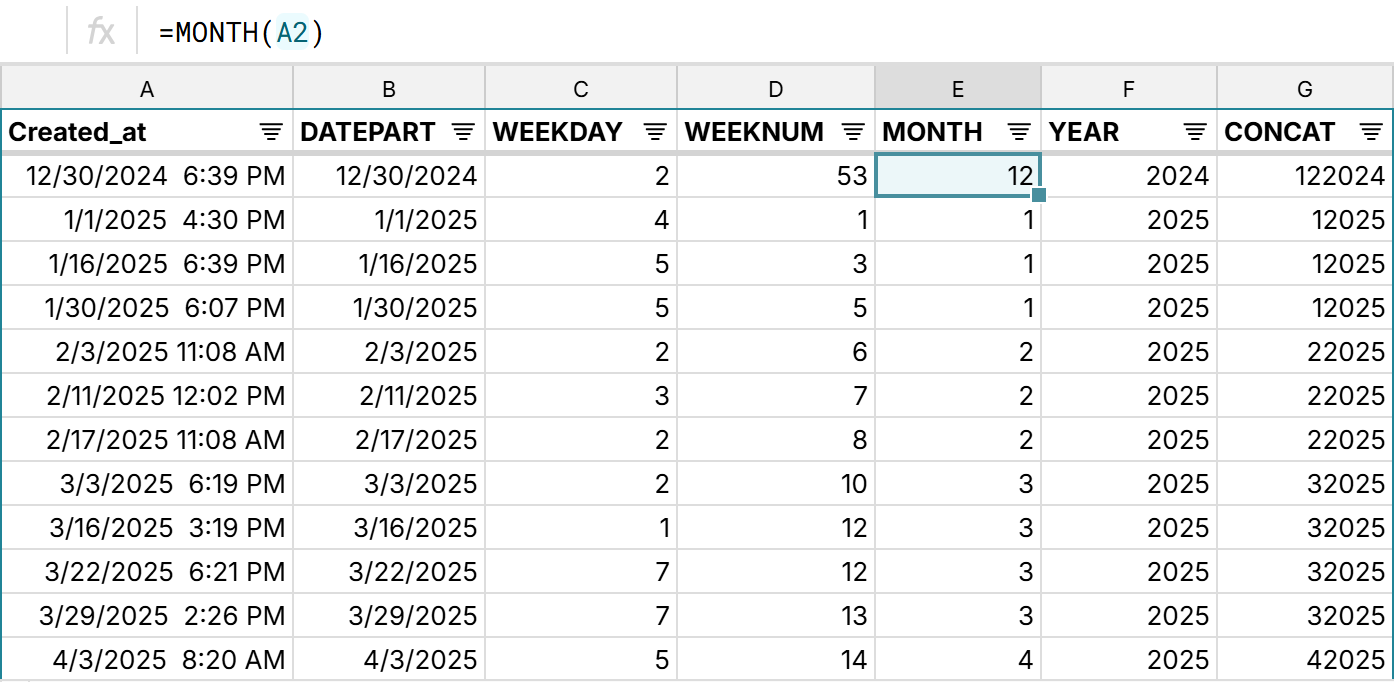
Using formulas to group by date
In addition to using pivot tables to group by date, you can also use spreadsheet formulas to group by date. Here are a few:
- DATEPART: Extracts the date part of a datetime
- WEEKDAY: Returns the weekday (1-7, starting at Sunday) of a date
- WEEKNUM: Returns the week number (1-52) of a date
- MONTH: Returns the month (1-12) of a date
- YEAR: Returns the year of a date value
- CONCAT: If your dataset spans multiple years, you can use the CONCAT function to distinguish date groupings by year (e.g. 122023 vs 122024)
Why Row Zero is best for date/time grouping
- Big data power and speed: Row Zero is the world's most powerful spreadsheet. You can easily work with millions of rows on a free plan and Enterprise plans support billion row datasets (1000x Excel's limit).
- Connected and auto-updating: Connect directly to your data source and build connected spreadsheets that auto-update and automatically apply date aggregations to new data. You can also easily update existing spreadsheets with a new file.
- Group by any level: Group datetimes by any level - second, minute, hour, day, week, month, quarter, year.
- Group by columns and rows: Easily group dates by columns or rows across big datasets.
- Dynamically build on top of pivot tables: Easily use pivot tables as source data for your analysis. Add calculated columns, reference pivot table data in formulas, create pivot charts, and create pivot tables from pivot tables. Everything built on top of your pivot table will automatically update and stay in sync with your pivot table as you make changes (filter, sort, add new data, etc.).
- Count unique by date grouping: Row Zero has a built-in pivot table count unique calculation so you can easily make pivot tables count unique by month, week, etc. This is very useful for calculating daily active users, monthly unique logins, etc.
Row Zero offers truly dynamic pivot tables that make it easy to work with big, dynamic datasets. Try for free at RowZero.com.
2. Google Sheets Pivot Table Group by Date
Like Row Zero, Google Sheets also has built-in pivot table date aggregation but it's a bit harder to discover. Here's how create pivot date groups in Google Sheets:
- Open a new workbook and get your data ready
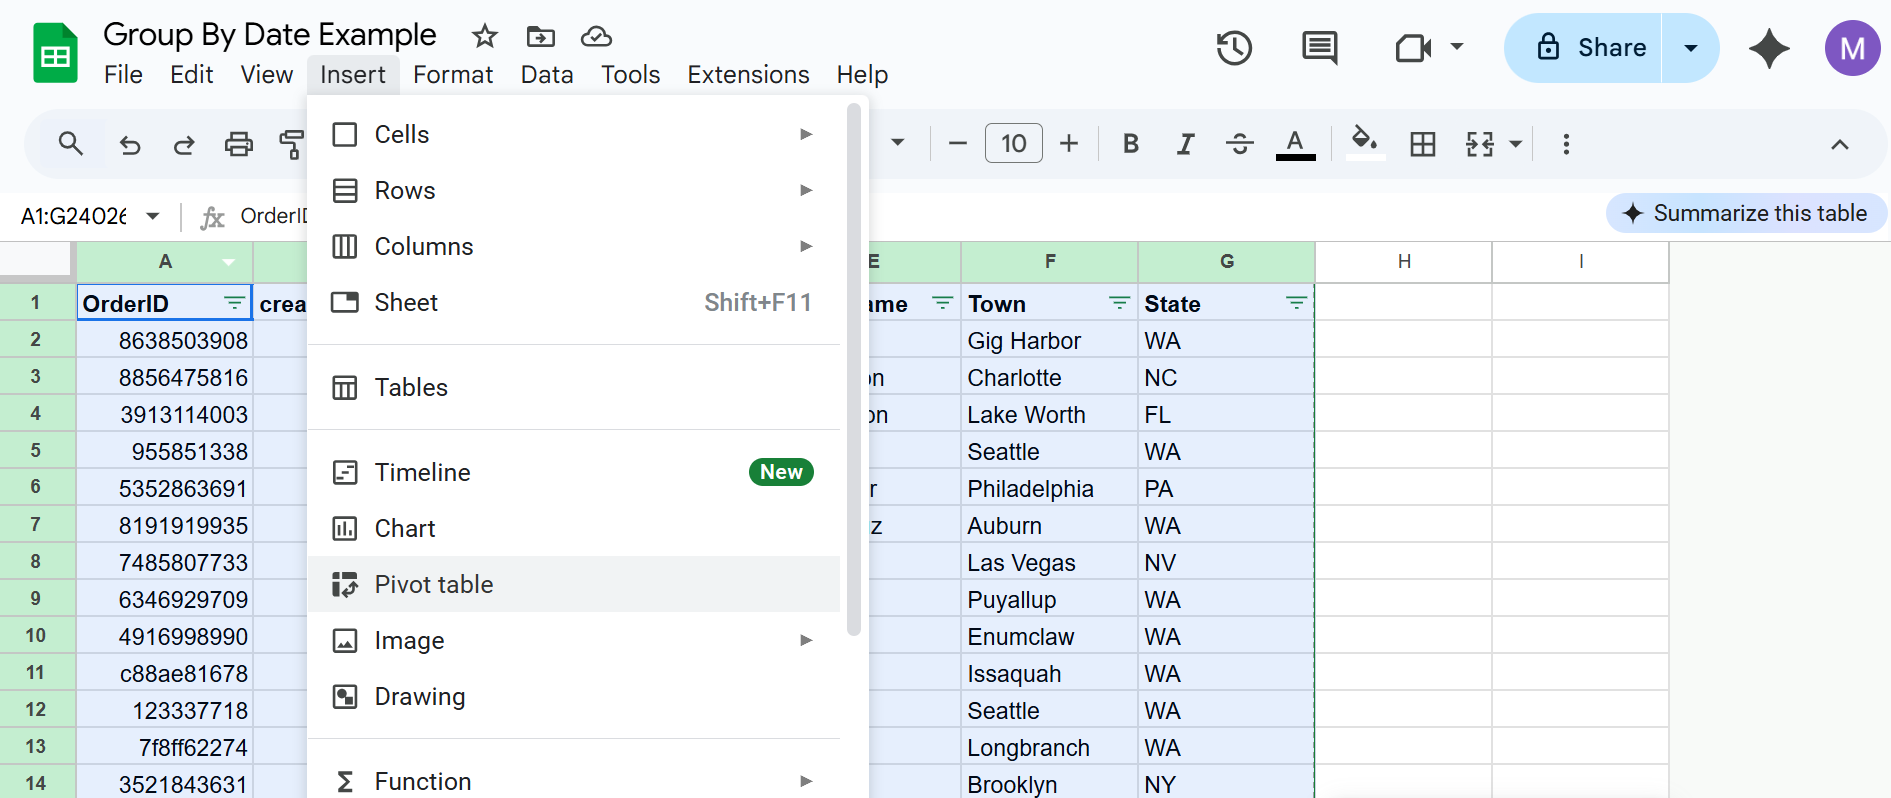
- Insert pivot table: Select your data and go to Insert, Pivot Table to create a pivot table.
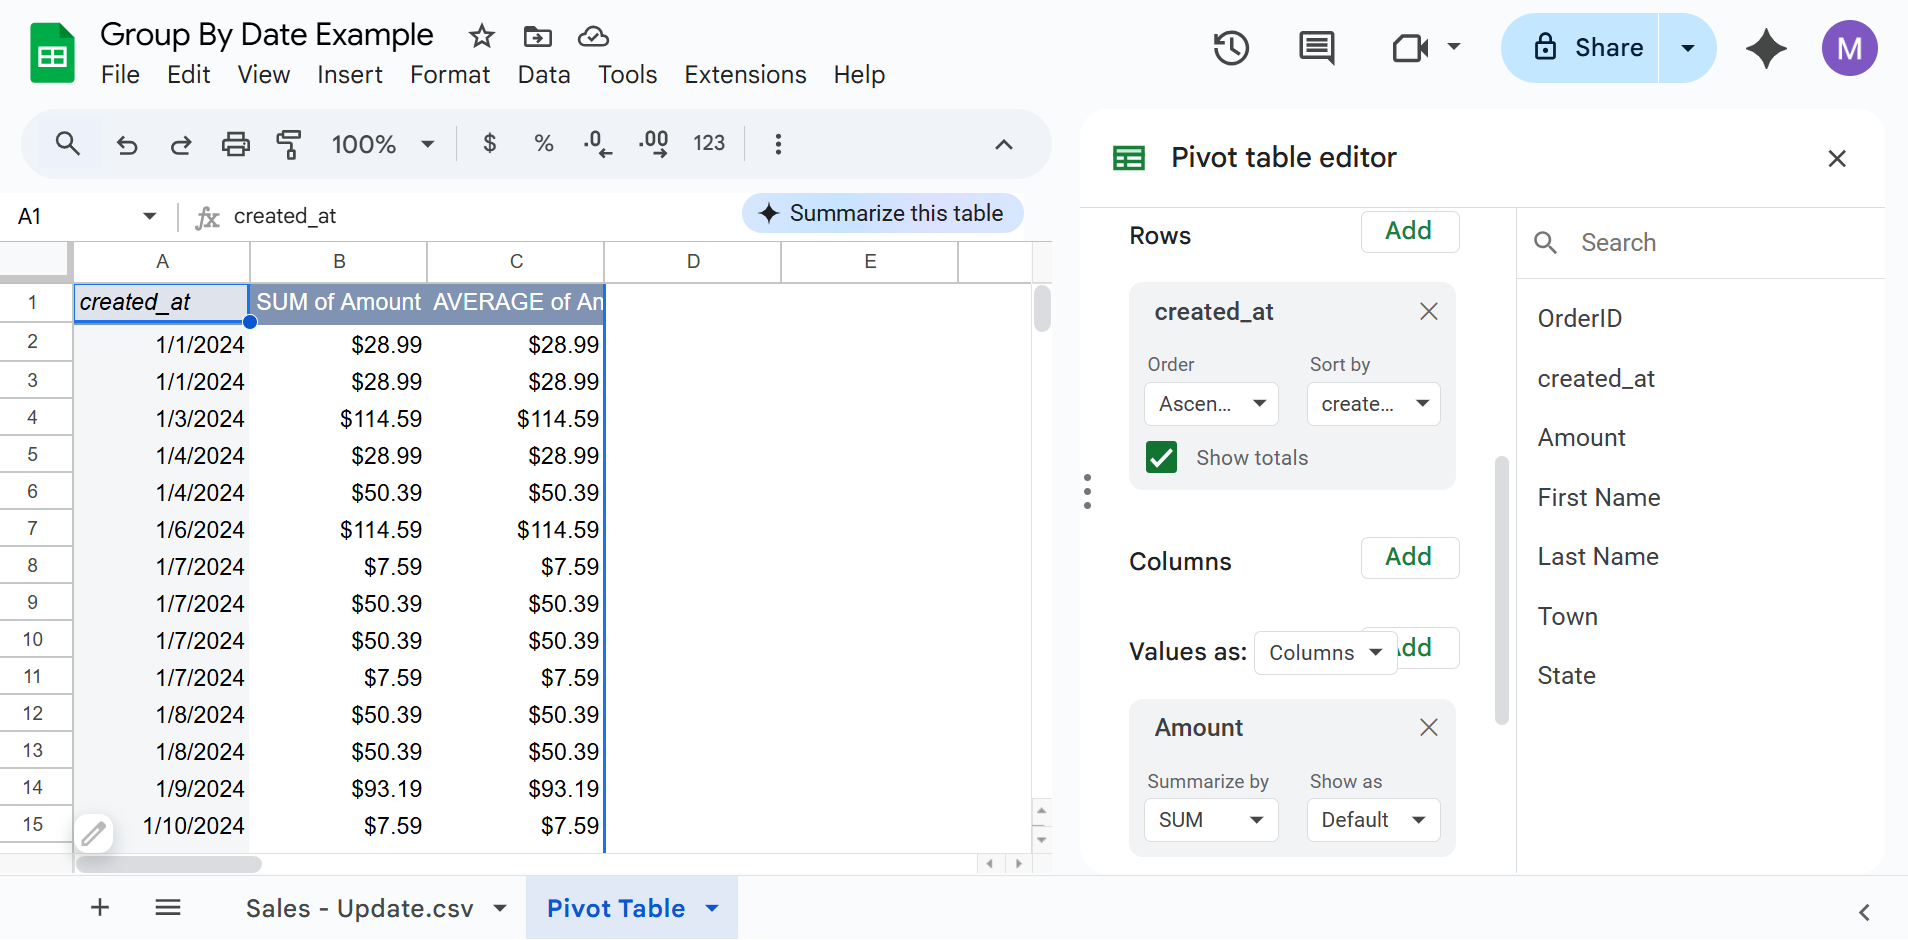
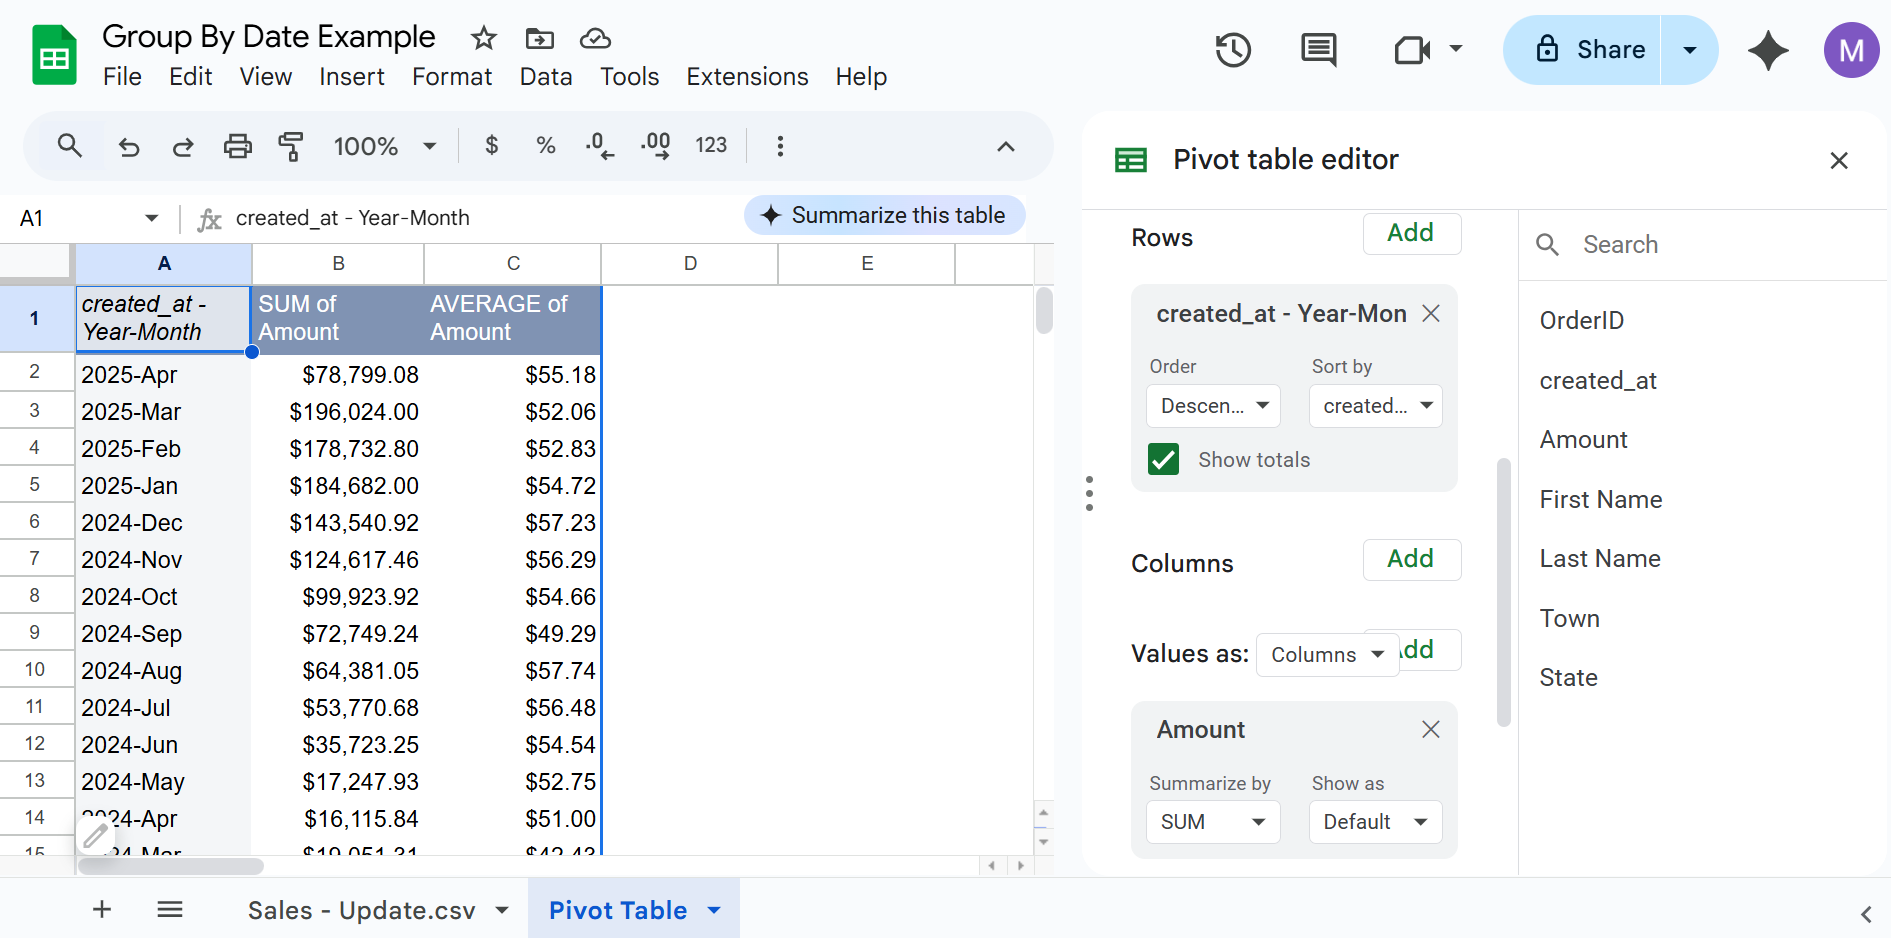
- Drag date field to rows: Drag your date field to rows and drag whatever you want to evaluate to values and optionally drag a field to columns.
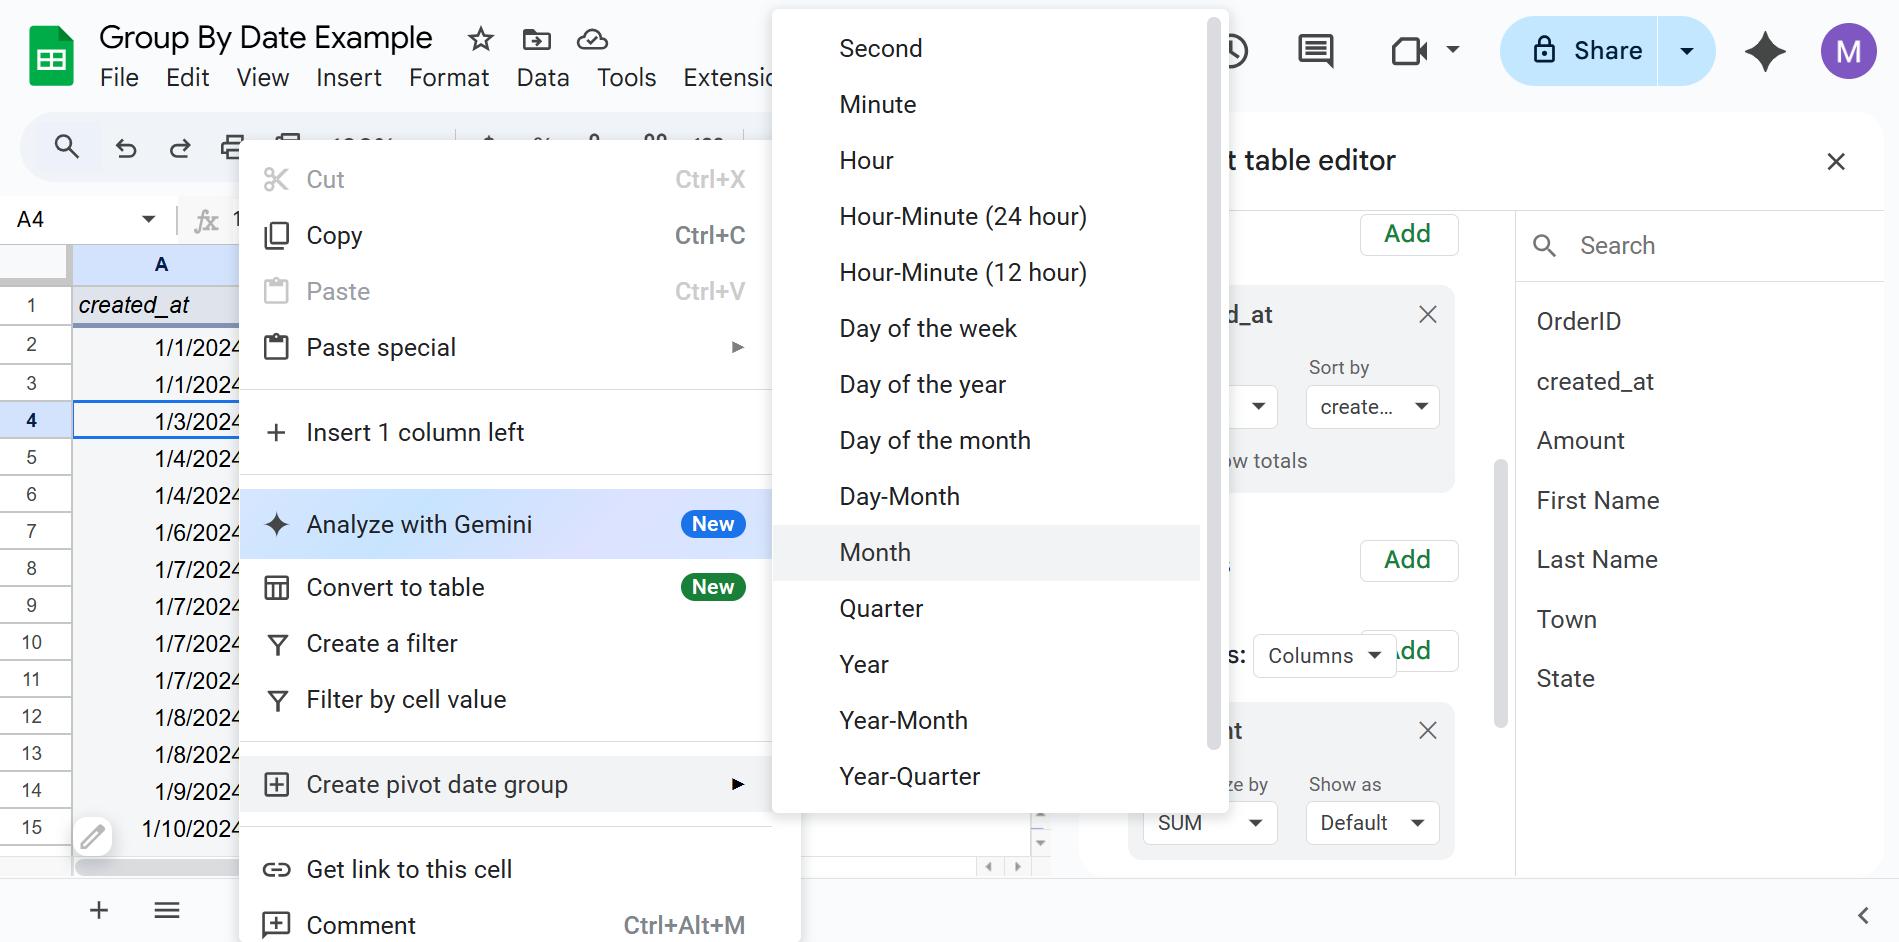
- Create pivot date group: Right click on your date column and select Create pivot date group. Google Sheets pivot tables group by any datetime aggregation from second to year.
If you want to group columns by date, there is a pretty big limitation. Because date aggregation is applied after the pivot table is created, you cannot aggregate dates in columns if your dataset has more than 18,278 rows. 18,278 is the Google Sheets column limit, so your spreadsheet will throw an error if you try to group pivot table columns on datasets larger than the limit.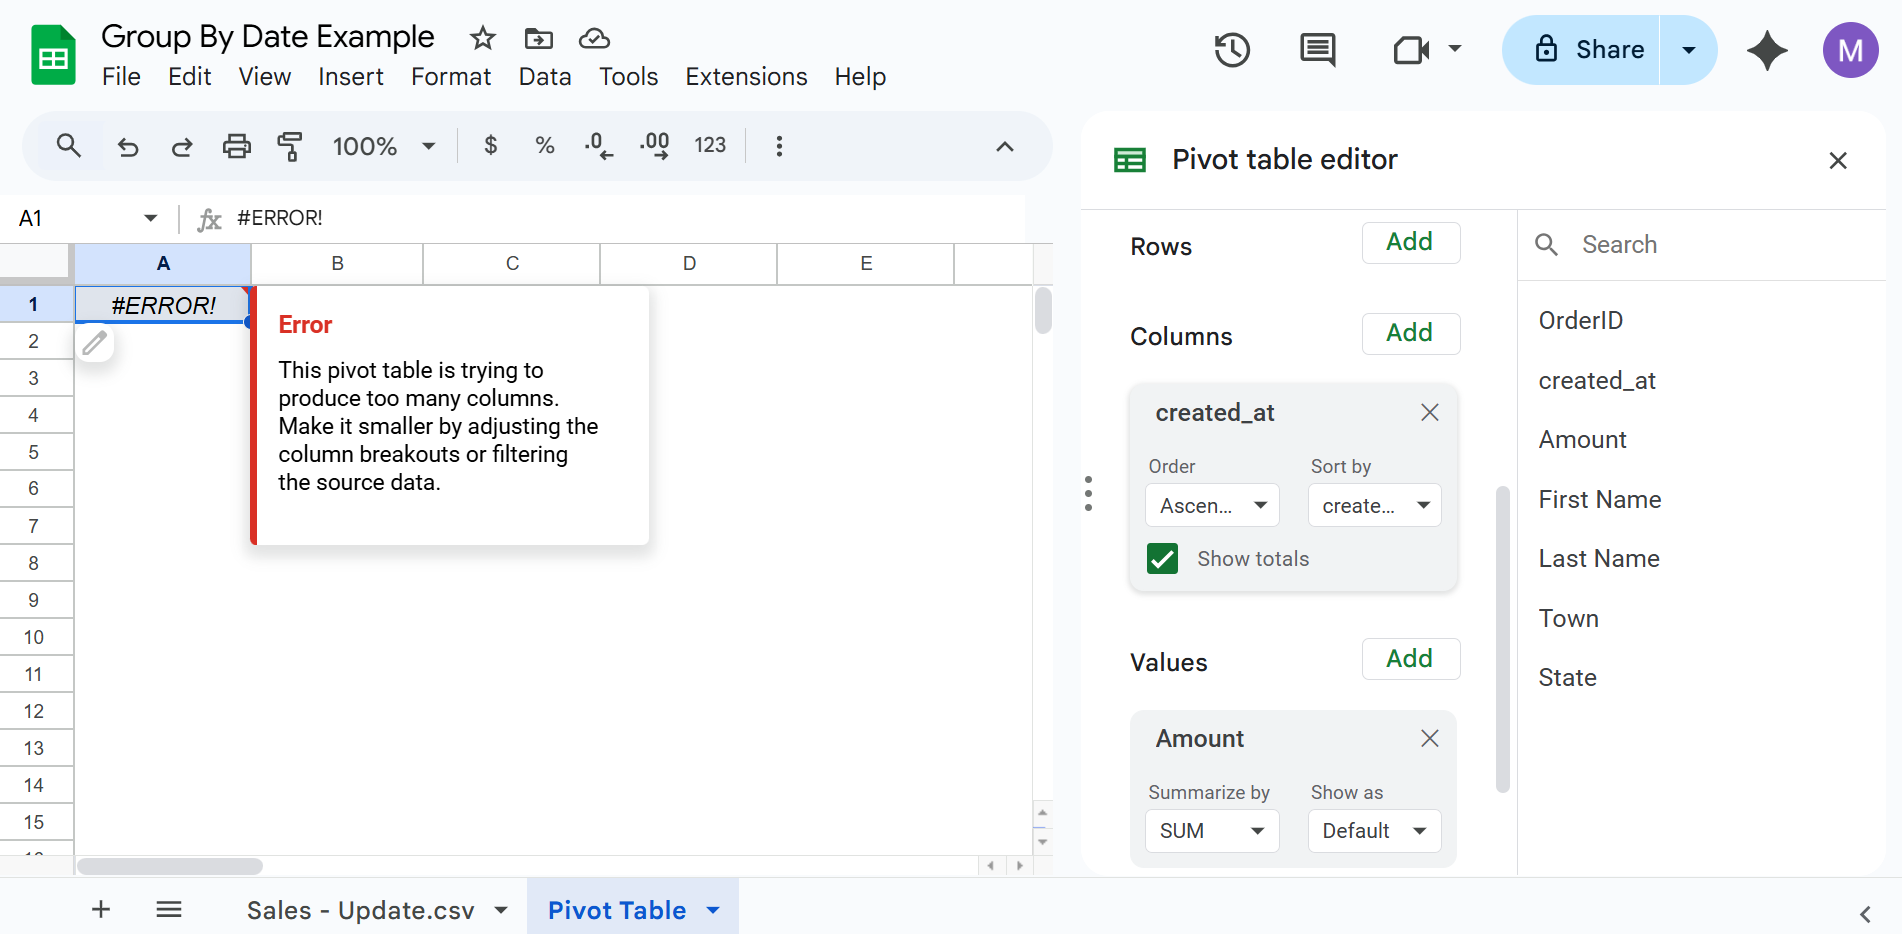
If you're working with a smaller dataset, then the process is very similar to grouping rows by dates. Right click in the header column and select Create pivot date group. 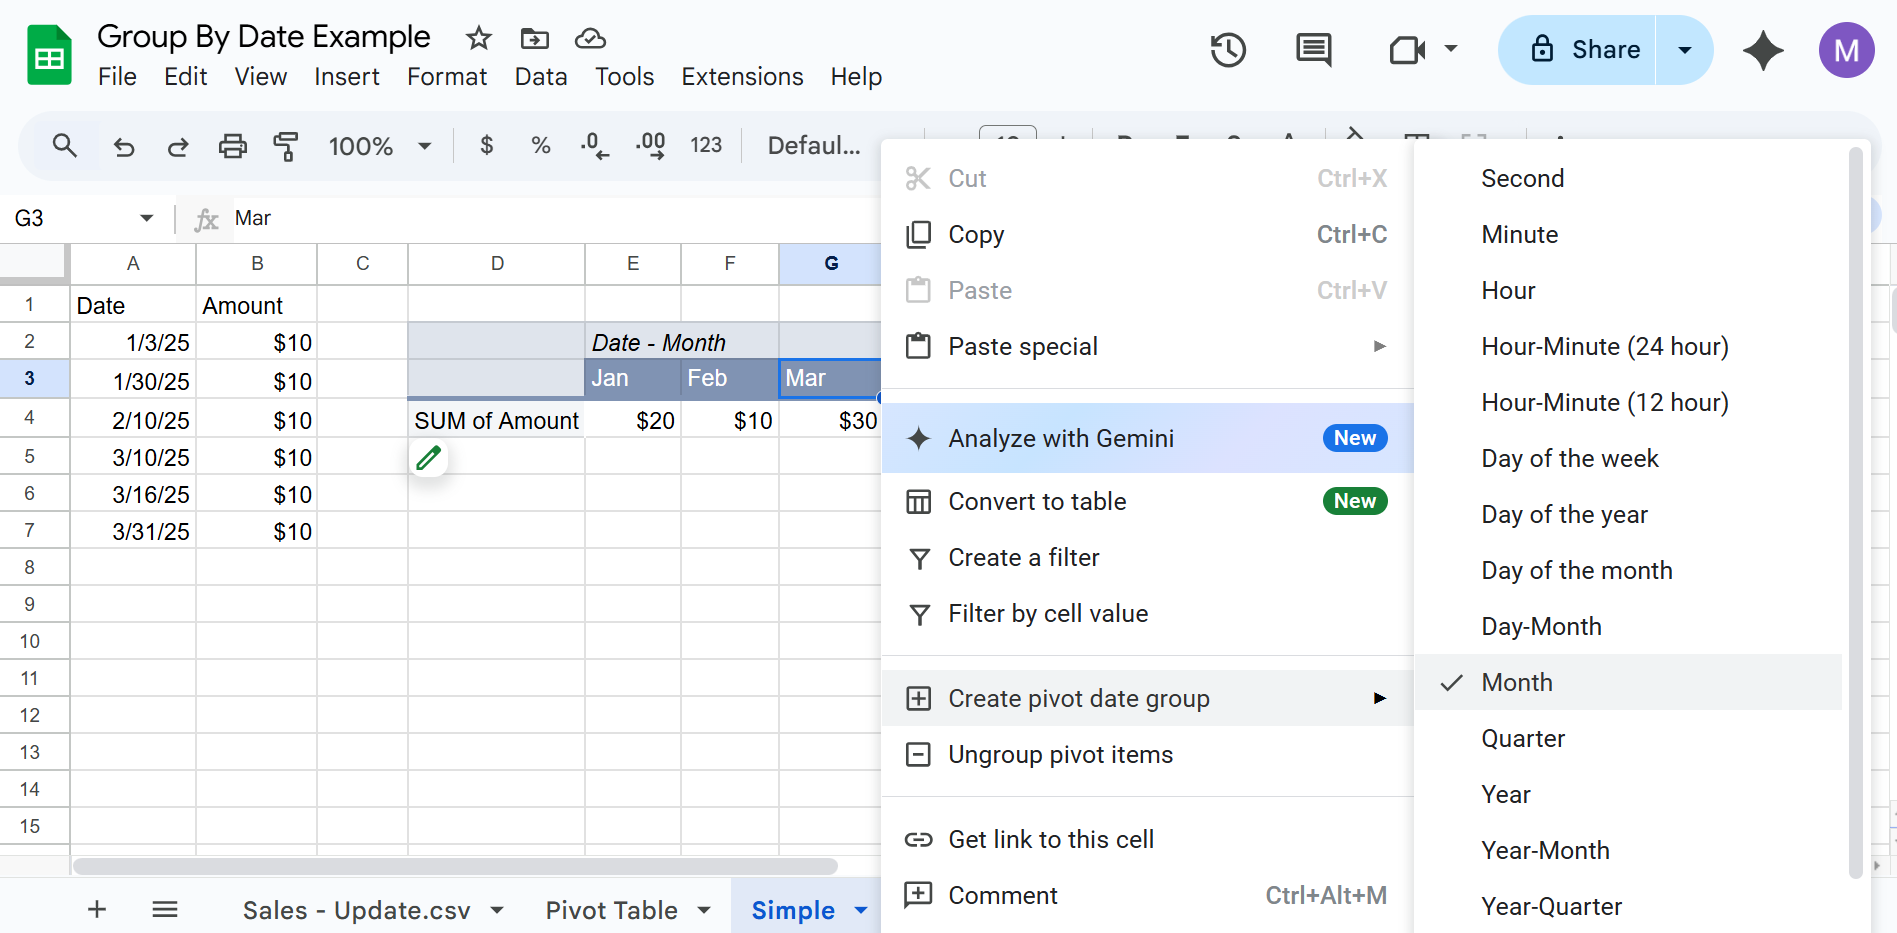
3. Excel Pivot Table Group by Month, Quarter, Year
Excel pivot tables automatically group dates by month, quarter, and year. While this is convenient in some situations it also is more limited than what you can do in Row Zero and Google Sheets. Here's how to group by date in Excel pivot tables:
- Open a new workbook and get your data ready
- Insert a pivot table
- Drag date field to rows: Drag your date field to rows and drag whatever you want to evaluate to values and optionally drag a field to columns. Excel automatically groups dates in pivot tables by month, quarter, year for datasets that span multiple years and automatically groups by day and month for shorter datasets. Click the + sign next to each date grouping to expand.
 To remove the date aggregations you can hit CTRL + Z to undo and this undoes the aggregations and just leaves the exact date or datetime. You can also remove the field from the pivot table editor.
Excel pivot table limitations
Excel pivot tables have several key limitations when analyzing large datasets with pivot table date groupings:
- Excel pivot tables are not dynamic by default (don't update as source data changes), which is not ideal if you plan on editing source data or updating with new data. You can manually refresh or use VBA to automatically update pivot tables, but it's not as easy as Google Sheets and Row Zero.
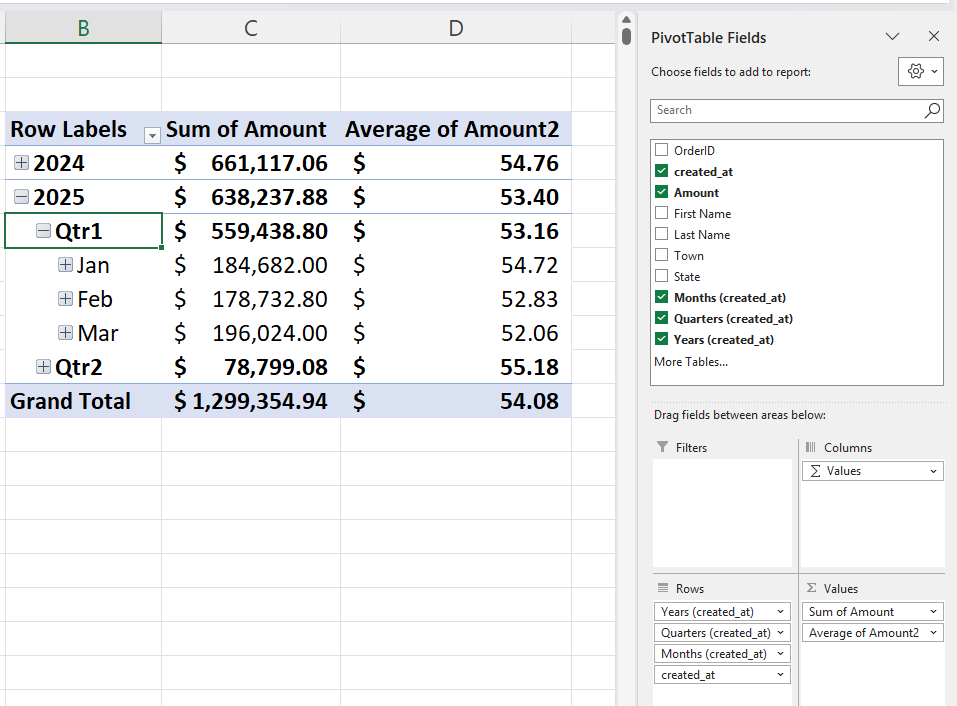
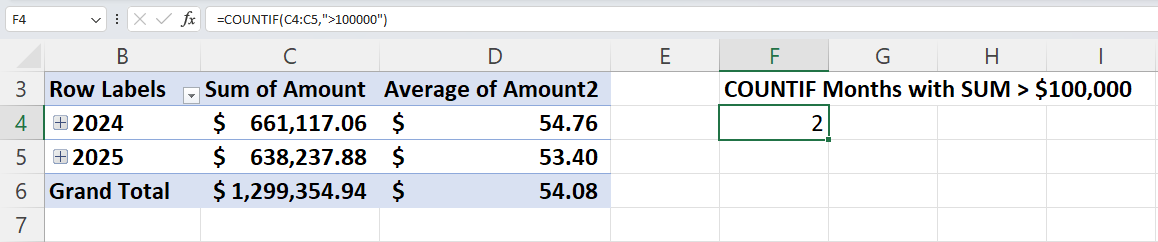
- The way Excel groups dates can screw up formulas that reference your pivot table data. Date fields are automatically grouped by month, quarter, year. If you write a simple formula to count the number of months in the data, for example, you'll get a different answer depending on whether your date aggregations are expanded or not and it's pretty challenging to get a correct answer. The dataset in the example below has 16 months of data with 5 months greater than $100K in sales, but you won't get that as your answer because of date aggregations. With the initial view, dates are grouped by year so attempting to count months with sales greater than $100K gives you an answer of two, which is just the visible Year aggregations.
 Expanding down to months, similarly is an issue:
 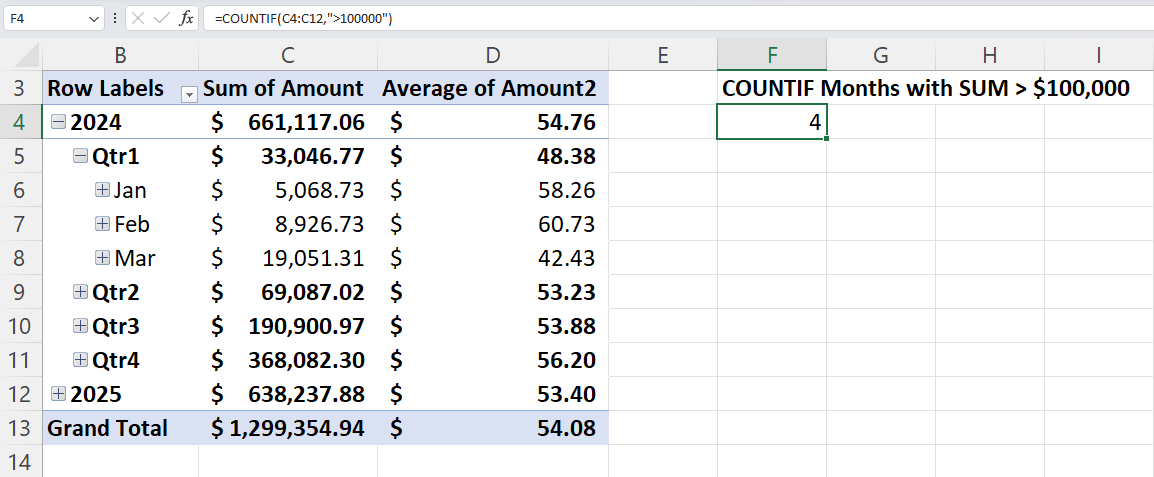 Also because Excel pivot tables don't auto-update, you need to manually change cell references as you expand or contract the date aggregations (e.g. click + next to year to expand to quarters). This makes it impractical to write formulas that reference data in pivot tables grouped by date and severely limits what you can do with Excel pivot tables. Row Zero and Google Sheets do not aggregate dates like this and make it much easier to build analysis on top of pivot tables.
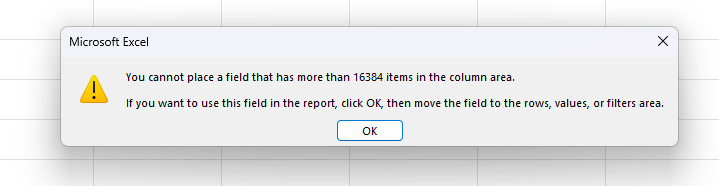
 - You can't group pivot table columns by date if your dataset is larger than 16,384 rows. This is the Excel max column number and it throws an error before it can aggregate by date.
- Excel has an overall row limit of 1,048,576 rows, so you can't easily pivot large datasets in Excel without workarounds (Google Sheets also has a similar limit).
Conclusion
It's easy to group by dates in pivot tables. You can apply any pivot table calculations to your data and group by dates in rows or columns. Row Zero is the most powerful solution for analyzing large datasets and grouping by date. Row Zero makes it easy to create auto-updating spreadsheets that aggregate datetimes by any level - second, minute, hour, day, week, month, year. Google Sheets pivot tables group by any date aggregation as well, but don't support large datasets. In Excel, pivot tables group by month, quarter, and year automatically but there are several limitations around data size and updating data. If you need to work with big, dynamic datasets and want to automate daily dashboards, WBRs, or monthly reports, Row Zero is the best spreadsheet for you and a powerful alternative to Excel and Google Sheets. If you need extra help, you can view a live example of pivot table date aggregation at Row Zero so you can see exactly how it works.