 Explore an example financial spreadsheet with 5.5 million rows of transaction data and a financial analysis including actuals vs forecast, a dashboard sheet, and slicers. While the example uses static data, you could easily connect to your data warehouse to pull in live data and build an auto-updating analysis.
This example financial spreadsheet includes 5 sheets:
- Orders - Raw transaction data of 5.5 million orders with Date, Customer ID, SKU, Quantity, Revenue, Cost, Profit. The final column shows an example of XLOOKUP to look up the Region of the customer from the Customers sheet.
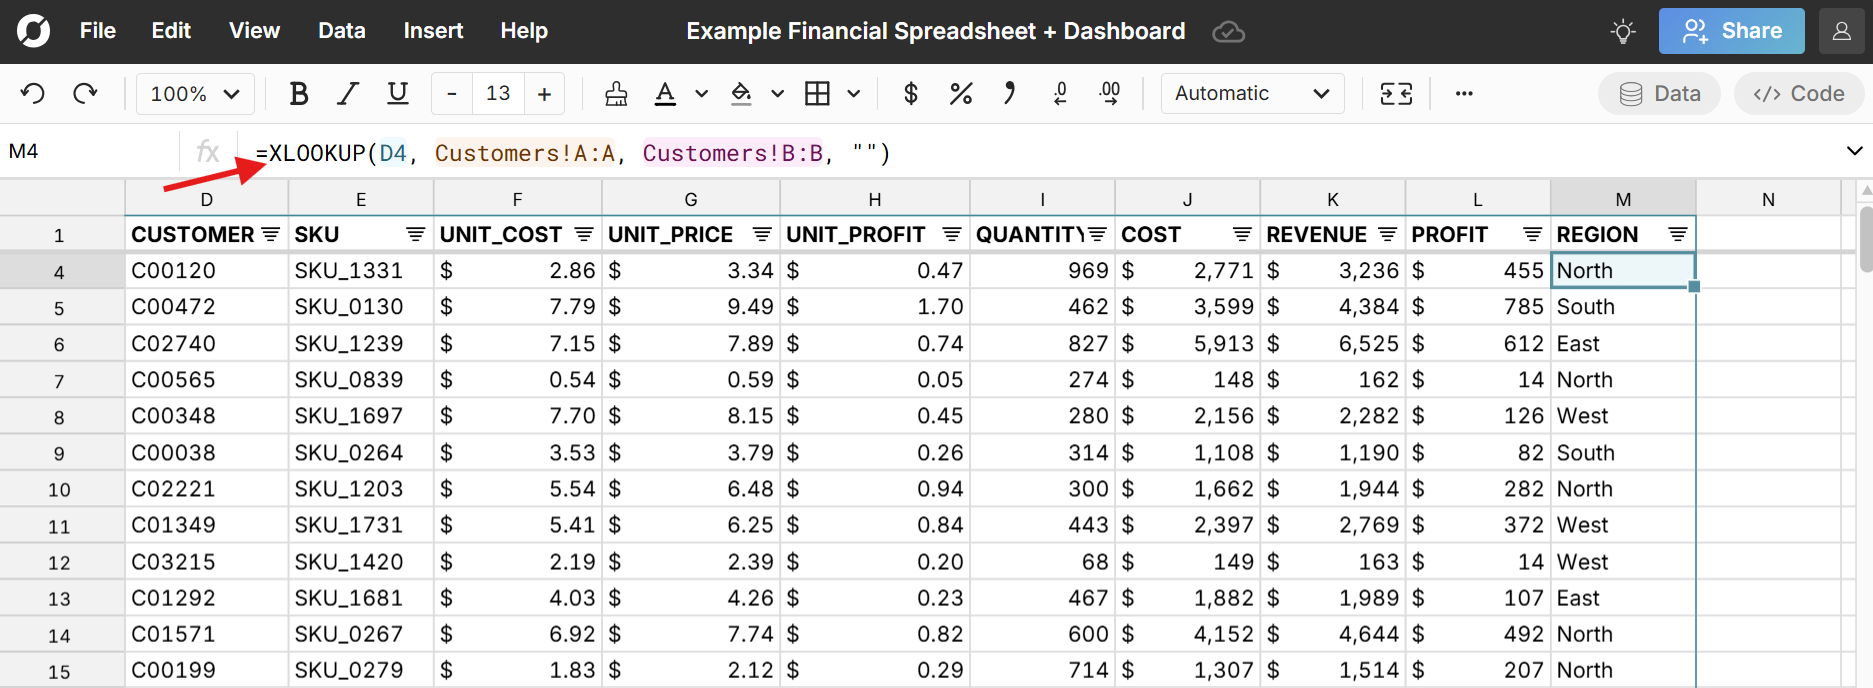
- Customers - List of all customers with Customer ID, Region, Name, and Date Created
- Forecast - Original forecast of revenue, cost, profit, and margin by month
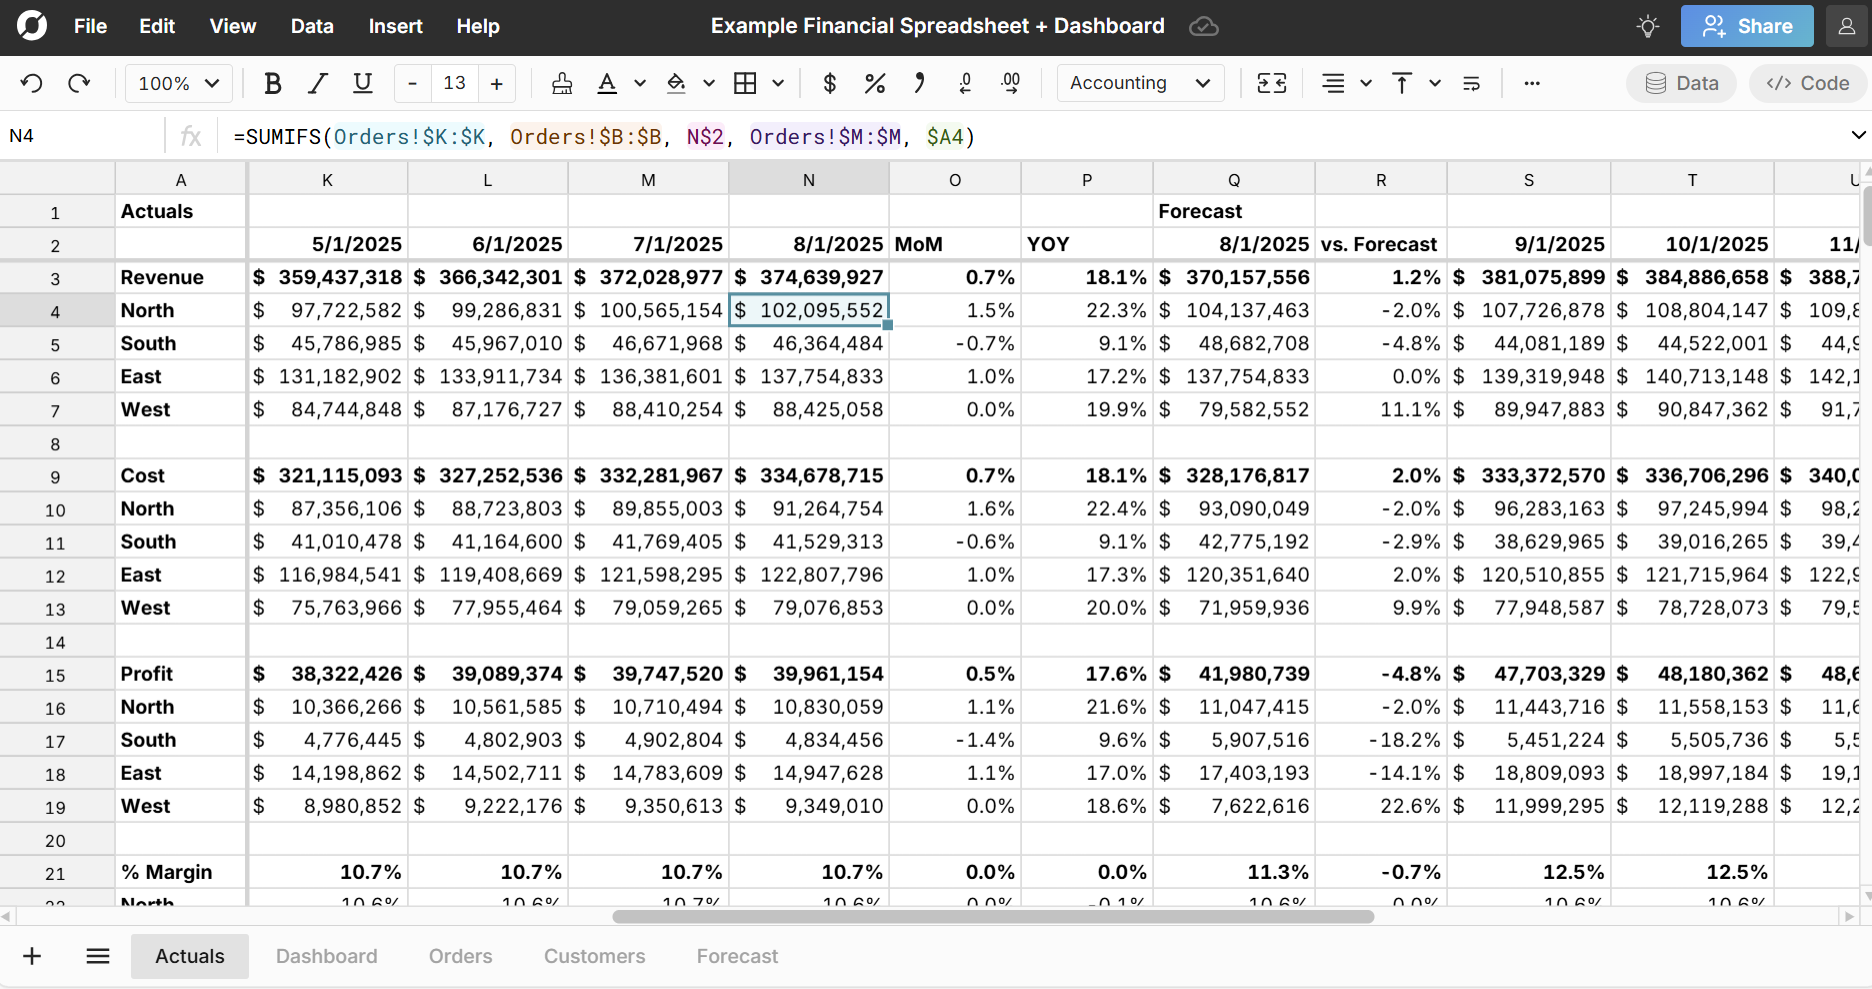
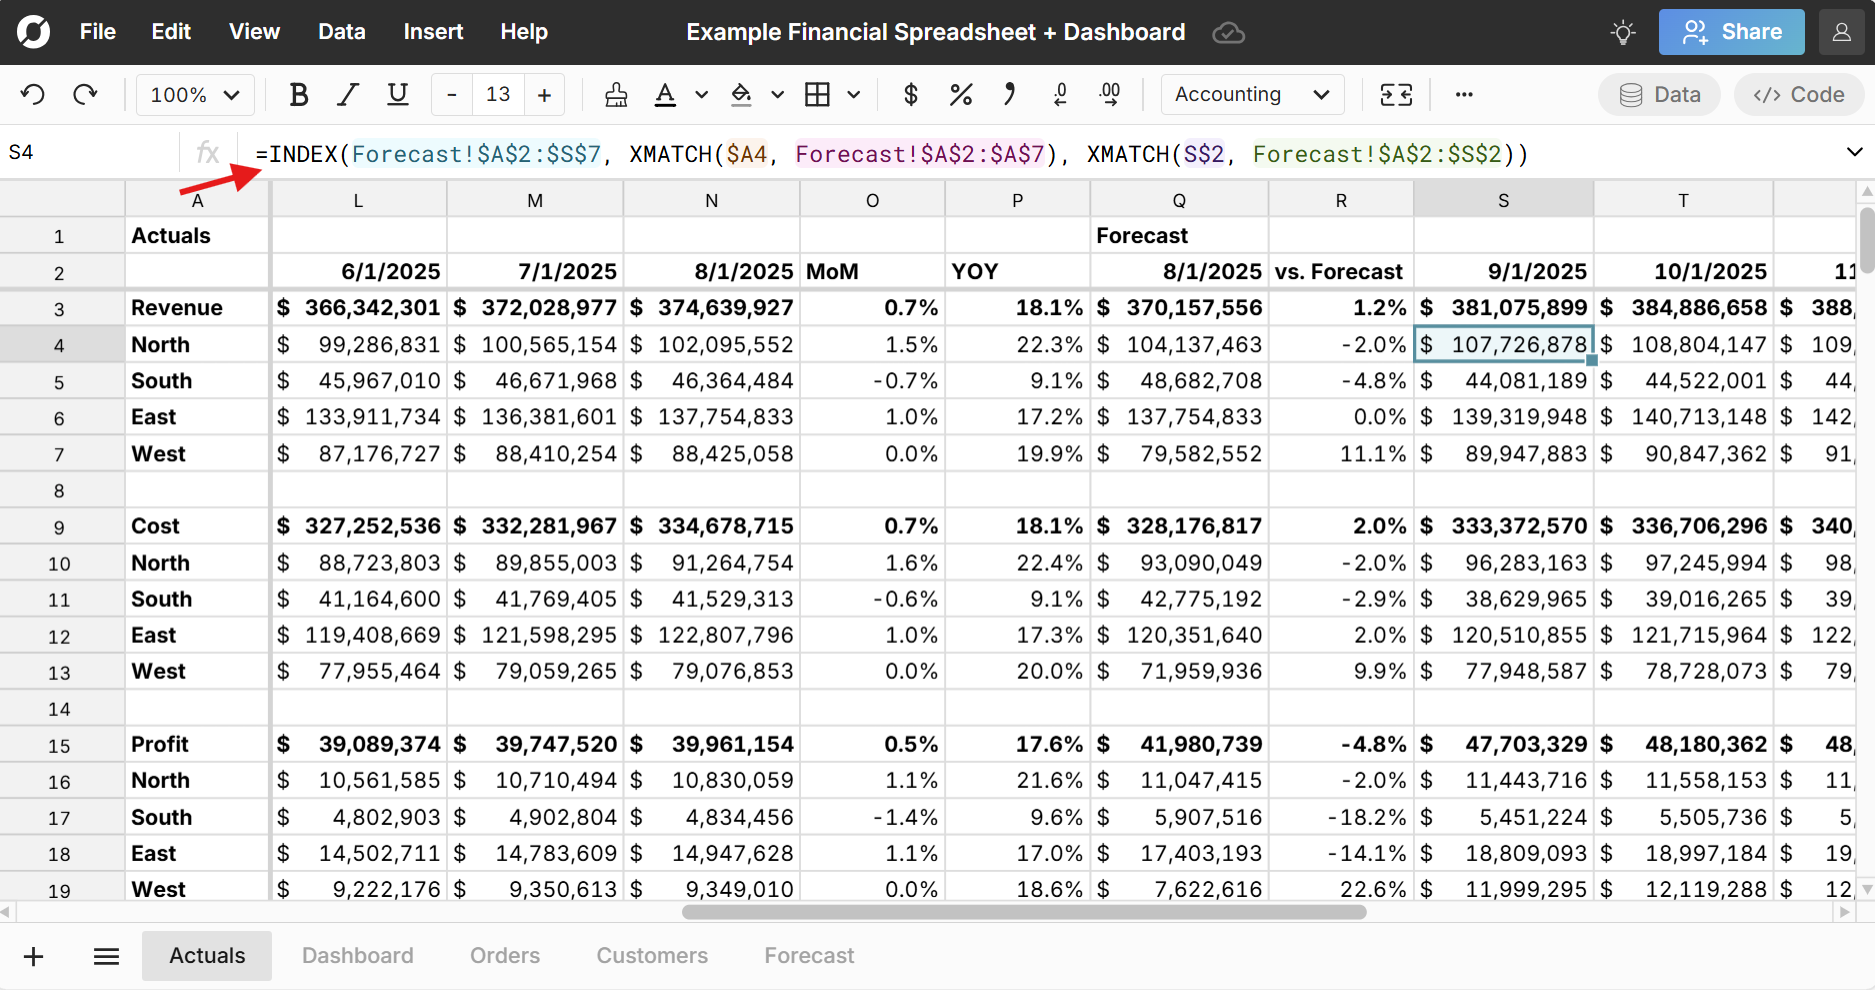
- Actuals - Tracks actual revenue, cost, profit, and margin by month and region using SUMIFS formulas and then compares the most recent month's actuals MOM, YOY, and vs Forecast. This sheet also uses INDEX/MATCH to pull in the corresponding forecast data by month.
- Dashboard - Dashboard sheet with 4 charts - Revenue, Profit, SKUs, and Volume - controlled by 4 slicers - Region, Customer, SKU, and Date and a corresponding pivot table.
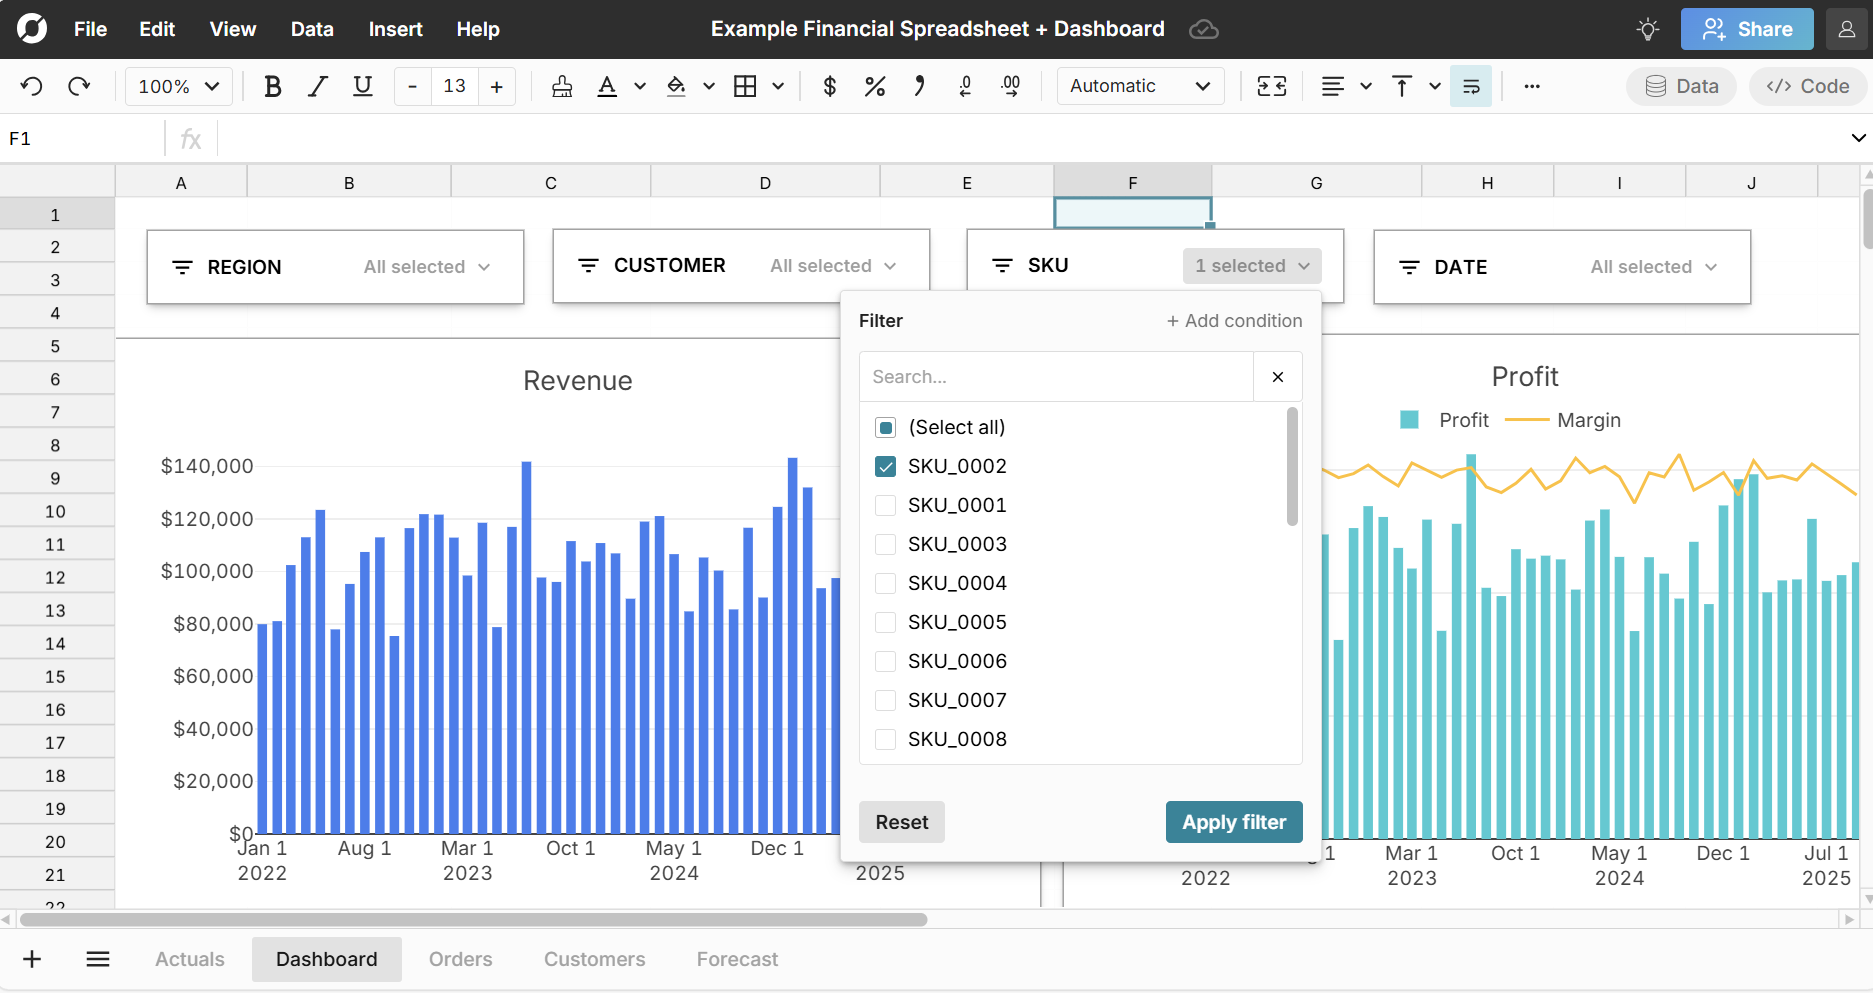 Note that the slicers dynamically filter each chart on the sheet.