This dataset provides comprehensive U.S. population statistics and census data by state. View income, age, gender, and race demographics by state and mappings of each state to ZIP codes, towns, counties, and regions. Explore for free in Row Zero, a powerful spreadsheet built for big data.
Open State Demographics Dataset
Dataset Summary
 This dataset includes comprehensive state demographics data with breakdowns for age, race, gender, and income by state. It also includes U.S. population change by state and the drivers of population change including births, deaths, domestic movers, and international immigration by state for all 50 states, the District of Columbia, and Puerto Rico. The dataset includes state FIPS codes which can be used to map states to county codes, ZIP codes, towns, and regions. The spreadsheet includes several different sheets of U.S. Census Data by state, including:
- Demographics by State
- Income by State
- Population Change by State
- Map ZIP to State, Town, Metro
- Map County to State
- Map Town to State
- Map State to Region
- Region Population Change
- Overall U.S. Demographics and Income
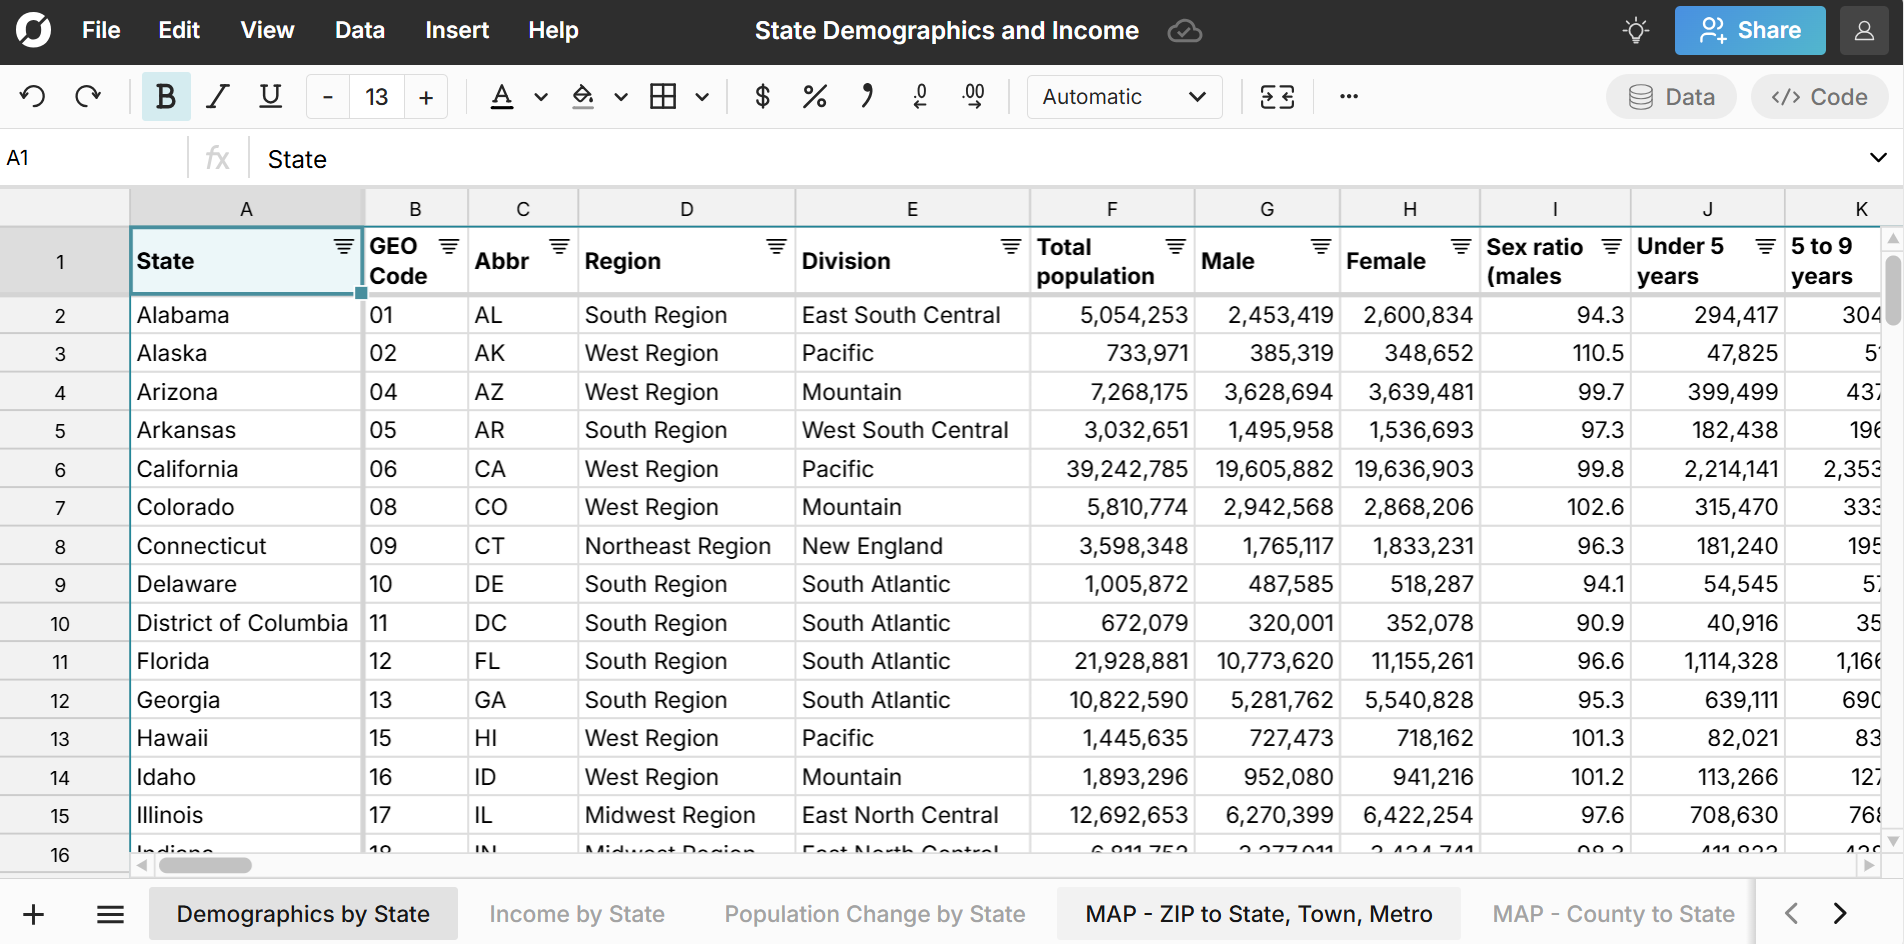
State Demographics - Age and Gender
The Demographics by State sheet includes state by state population by age and gender with both raw counts and percentages. 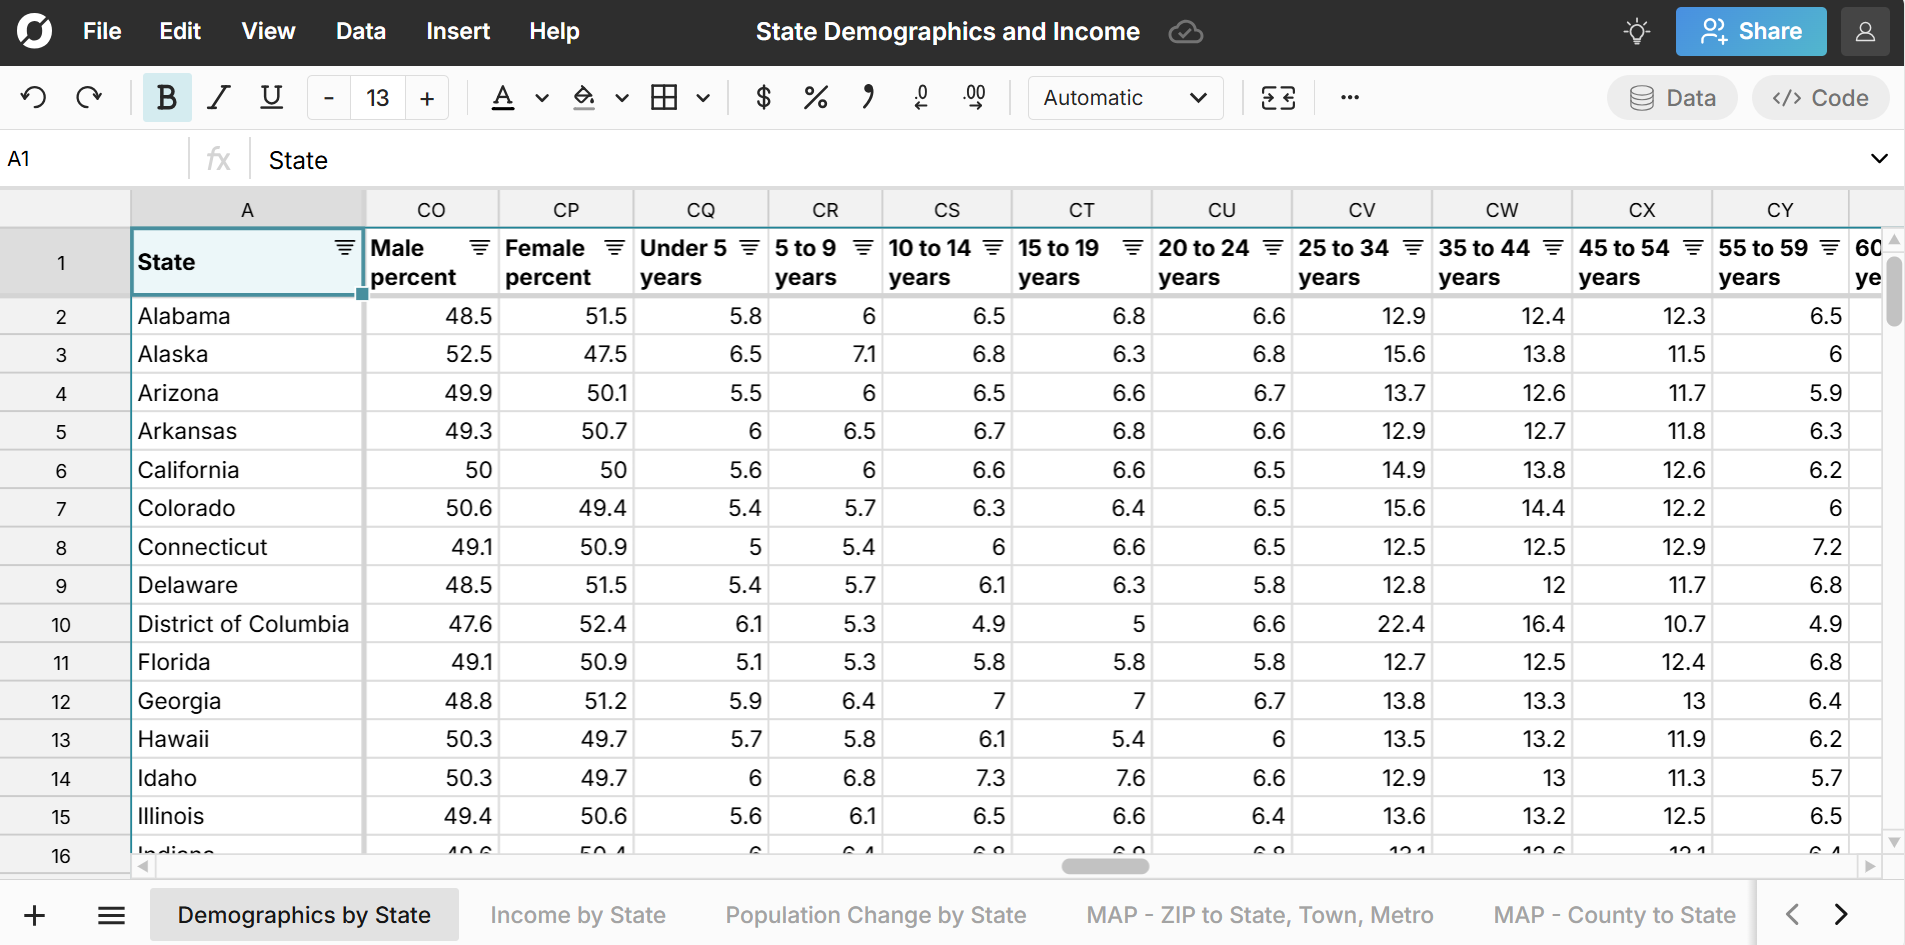
Race Demographics by State
The Demographics by State sheet also includes race breakdown by state with both raw counts and percentage breakdowns for single race and multiracial residents by state. 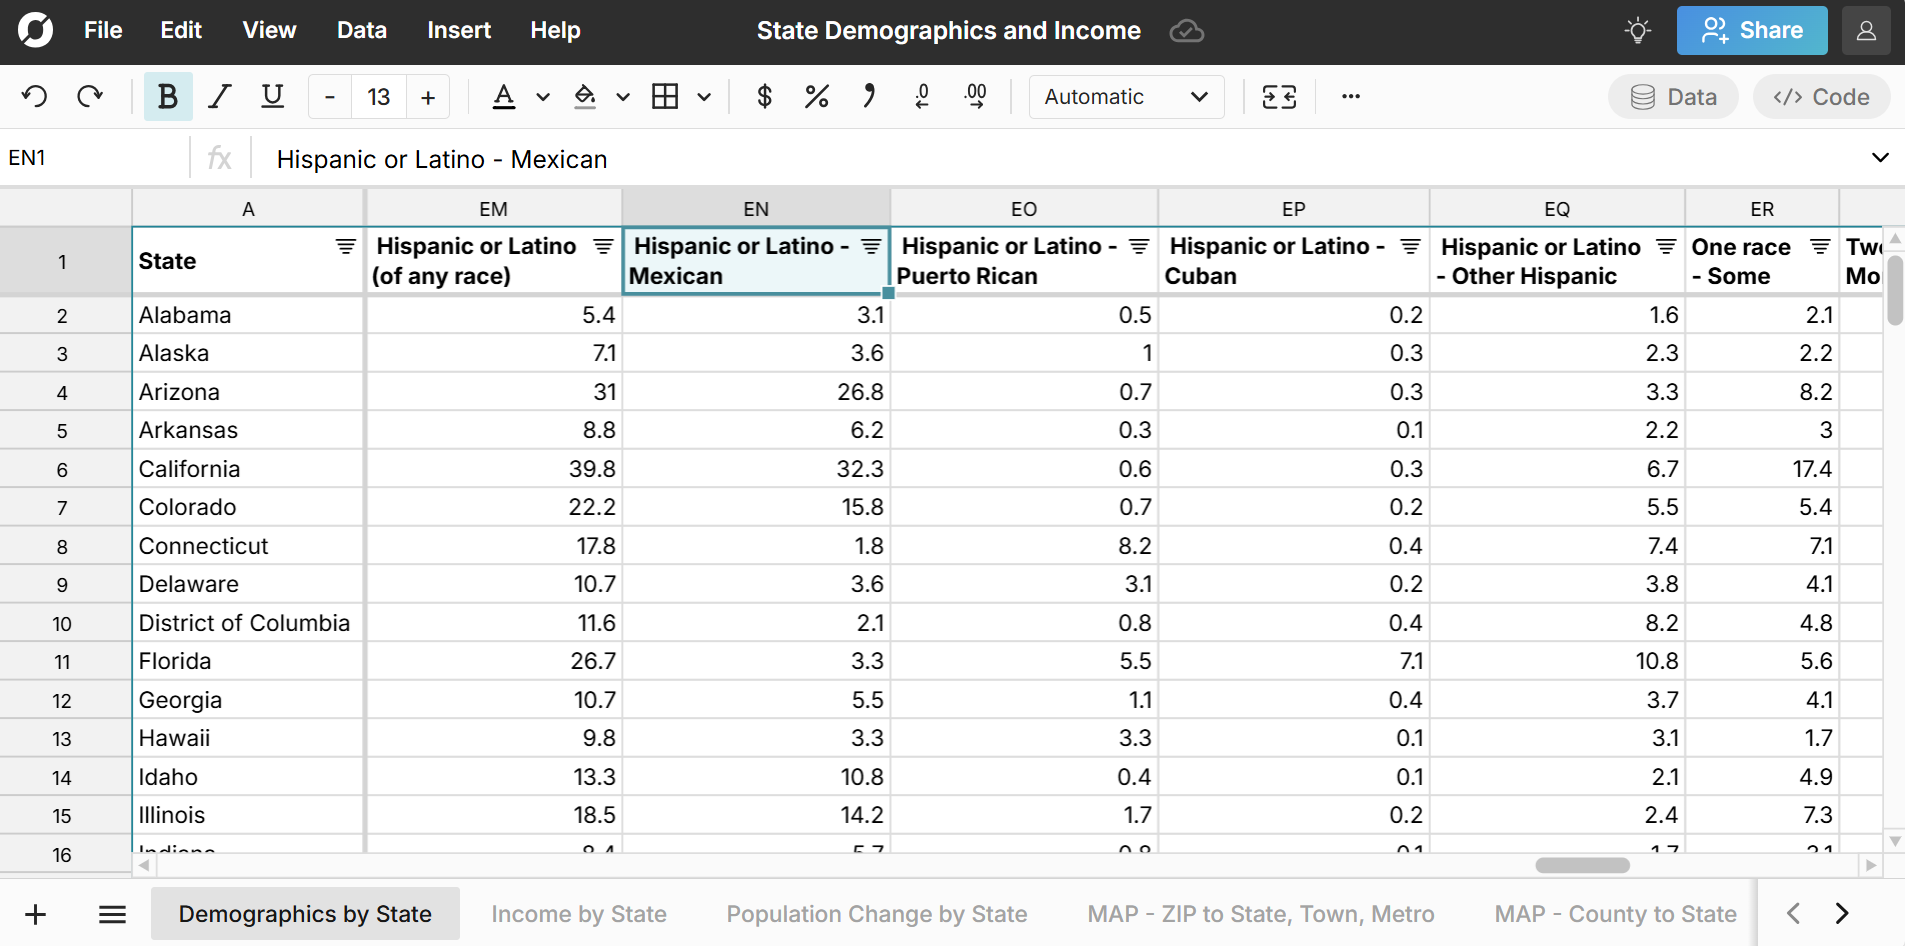 The race breakdown for each state includes:
- White
- Black or African American
- American Indian and Alaska Native
- Aztec
- Blackfeet Tribe
- Maya
- Barrow Inupiat
- Navajo Nation
- Nome Eskimo
- Other
- Asian
- Asian Indian
- Chinese
- Filipino
- Japanese
- Korean
- Vietnamese
- Other
- Native Hawaiian and Other Pacific Islander
- Chamorro
- Native Hawaiian
- Samoan
- Other
- Hispanic or Latino (of any race)
- Mexican
- Puerto Rican
- Cuban
- Other
Income by State
The Income by State sheet includes each state's median household income, mean income, and family income by state. 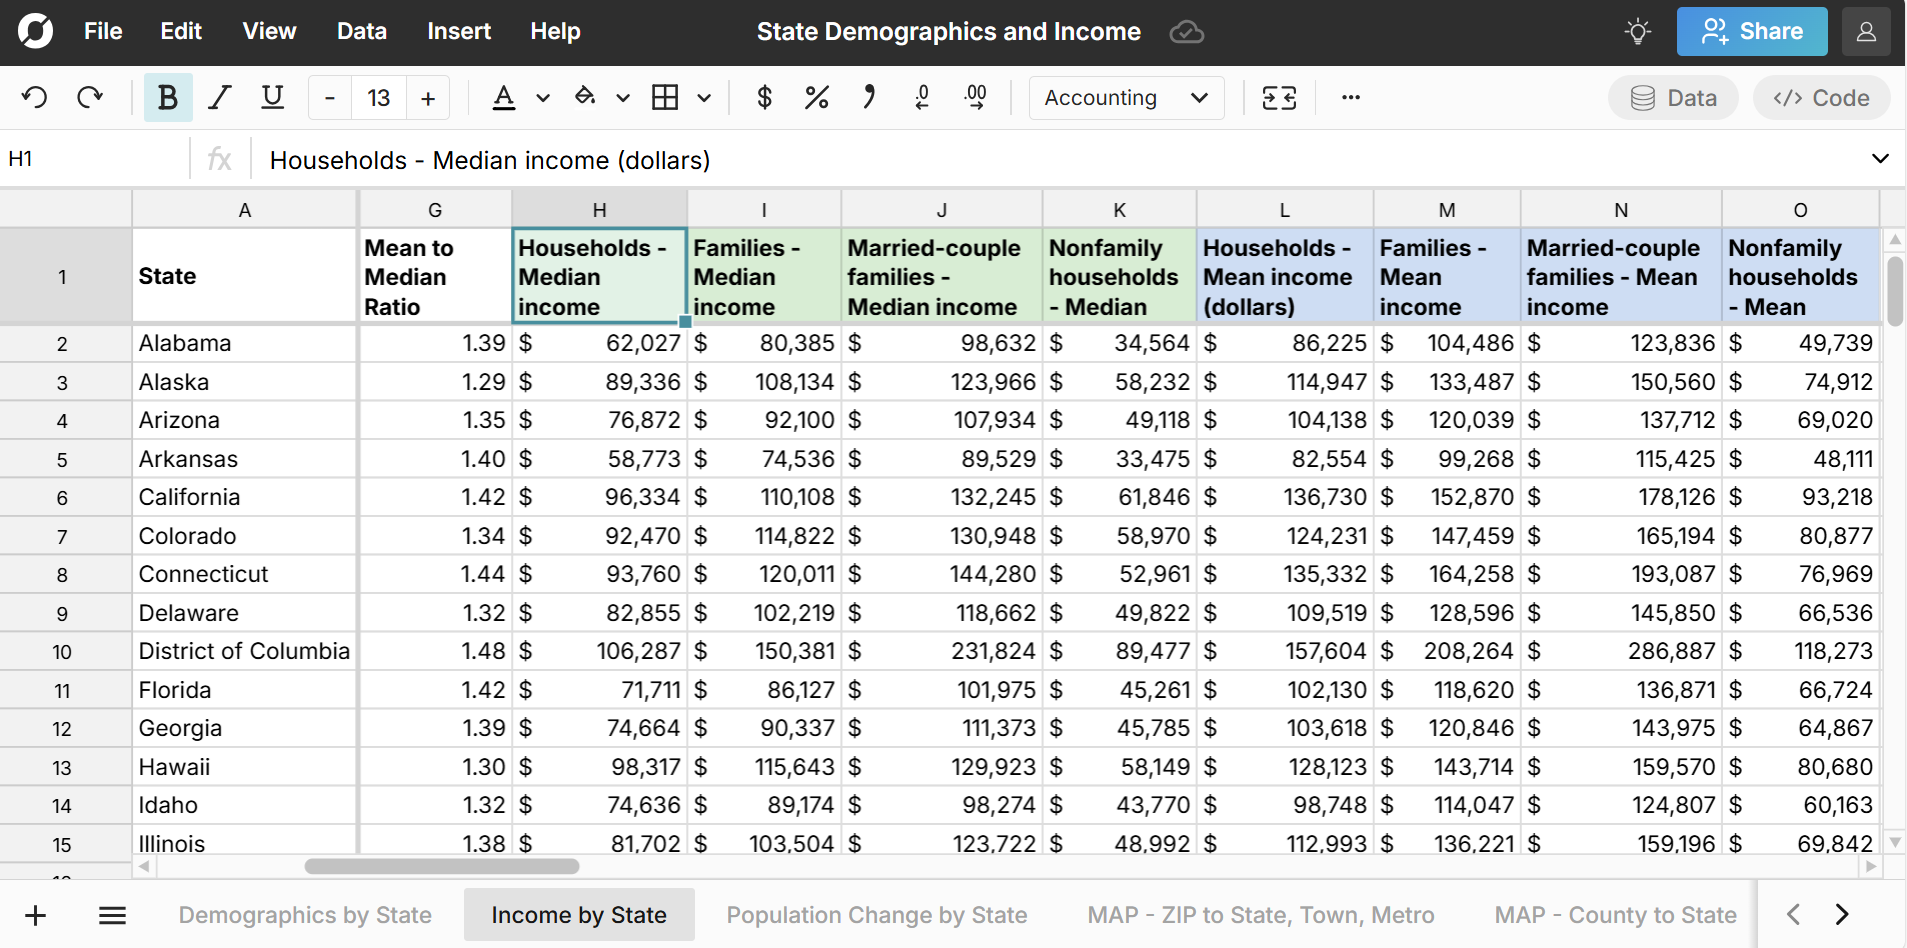 Compare median income by state and income inequality by state. The income breakdown for each state includes counts and percentage for the following income brackets:
- Less than $10,000
- $10,000 to $14,999
- $15,000 to $24,999
- $25,000 to $34,999
- $35,000 to $49,999
- $50,000 to $74,999
- $75,000 to $99,999
- $100,000 to $149,999
- $150,000 to $199,999
- $200,000 or more
State Population Change and Migration
The Population Change by State sheet lets you explore state population change over time, including births, deaths, domestic migration between states, and international migration by state. See what states attract the most new movers, what states are growing fastest, and the states with declining population. 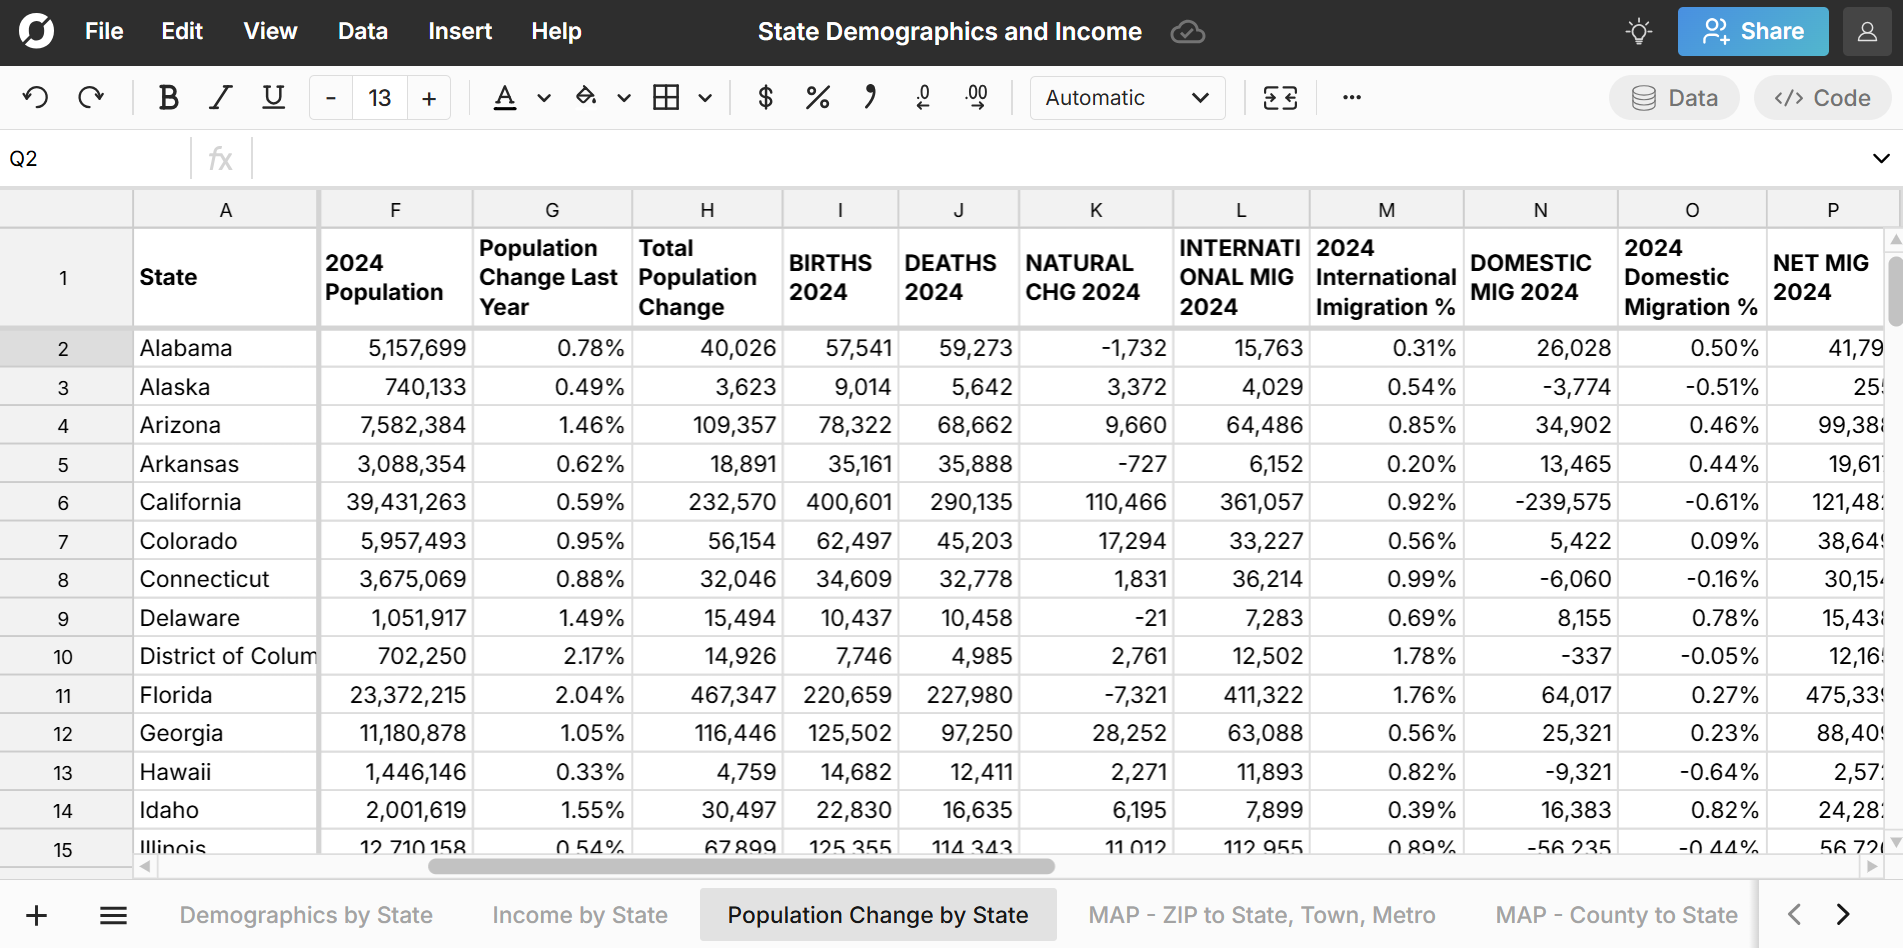
ZIP Code to State Mapping
The MAP - ZIP to State, Town, Metro sheet maps the list of all U.S. ZIP codes to state, town, and metro and includes the ZIP code population. You can use this to easily filter to a list of ZIP codes by state. You can also view ZIP code demographics here.
County to State Mapping
The MAP - County to State sheet lists the counties in each state, county population, and includes county percent of the state population, so you can sort the largest counties by state. You can also look up the list of county FIPS codes by state. 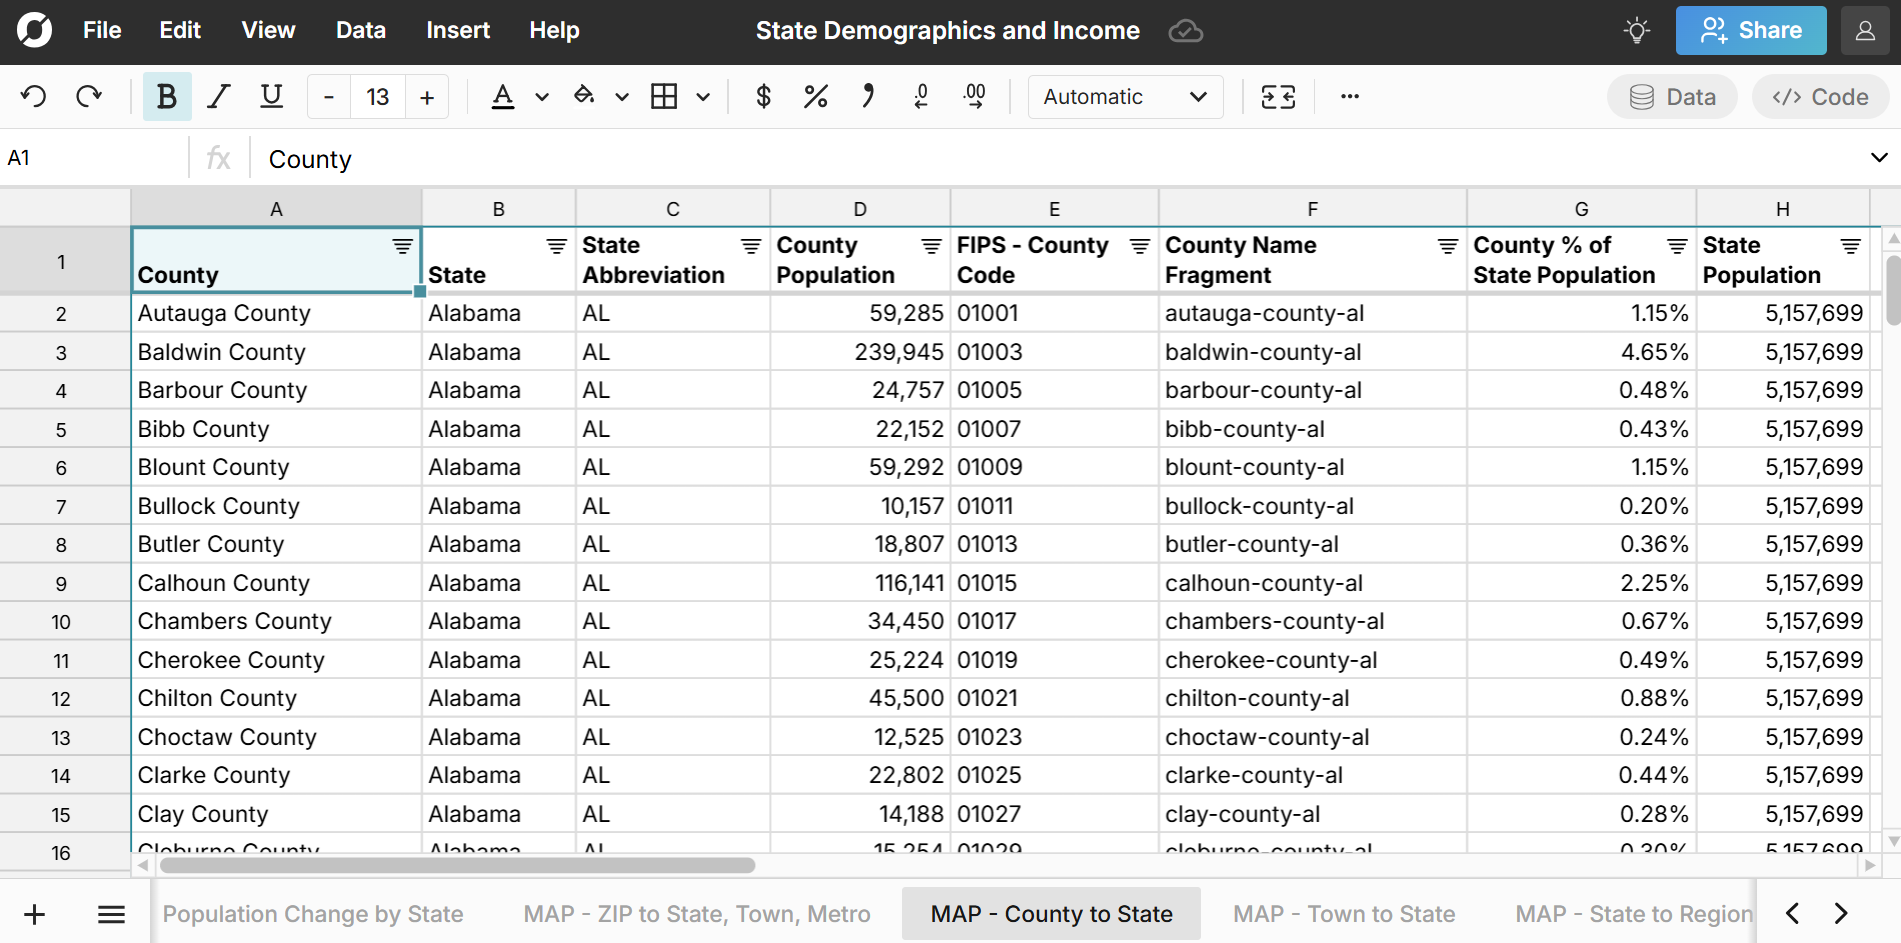 View the county demographics dataset.
City and Town to State Mapping
The MAP - Town to State sheet maps each U.S. town and city to state and includes the population of each town so you can sort the largest towns by state. View full demographic data by city here
State to Region Mapping
The MAP - State to Region sheet maps each state to a region and division (sub-region) including:
- 4 U.S. Regions: Northeast, Midwest, South, West
- 9 U.S. Sub-regions (Divisions): New England, Middle Atlantic, South Atlantic, East South Central, West South Central, East North Central, West North Central, Mountain, and Pacific
Region Population Change
The Region Population sheet provides a breakdown of U.S. population by region and division or sub-region. See U.S. migration by region and what regions are growing fastest. 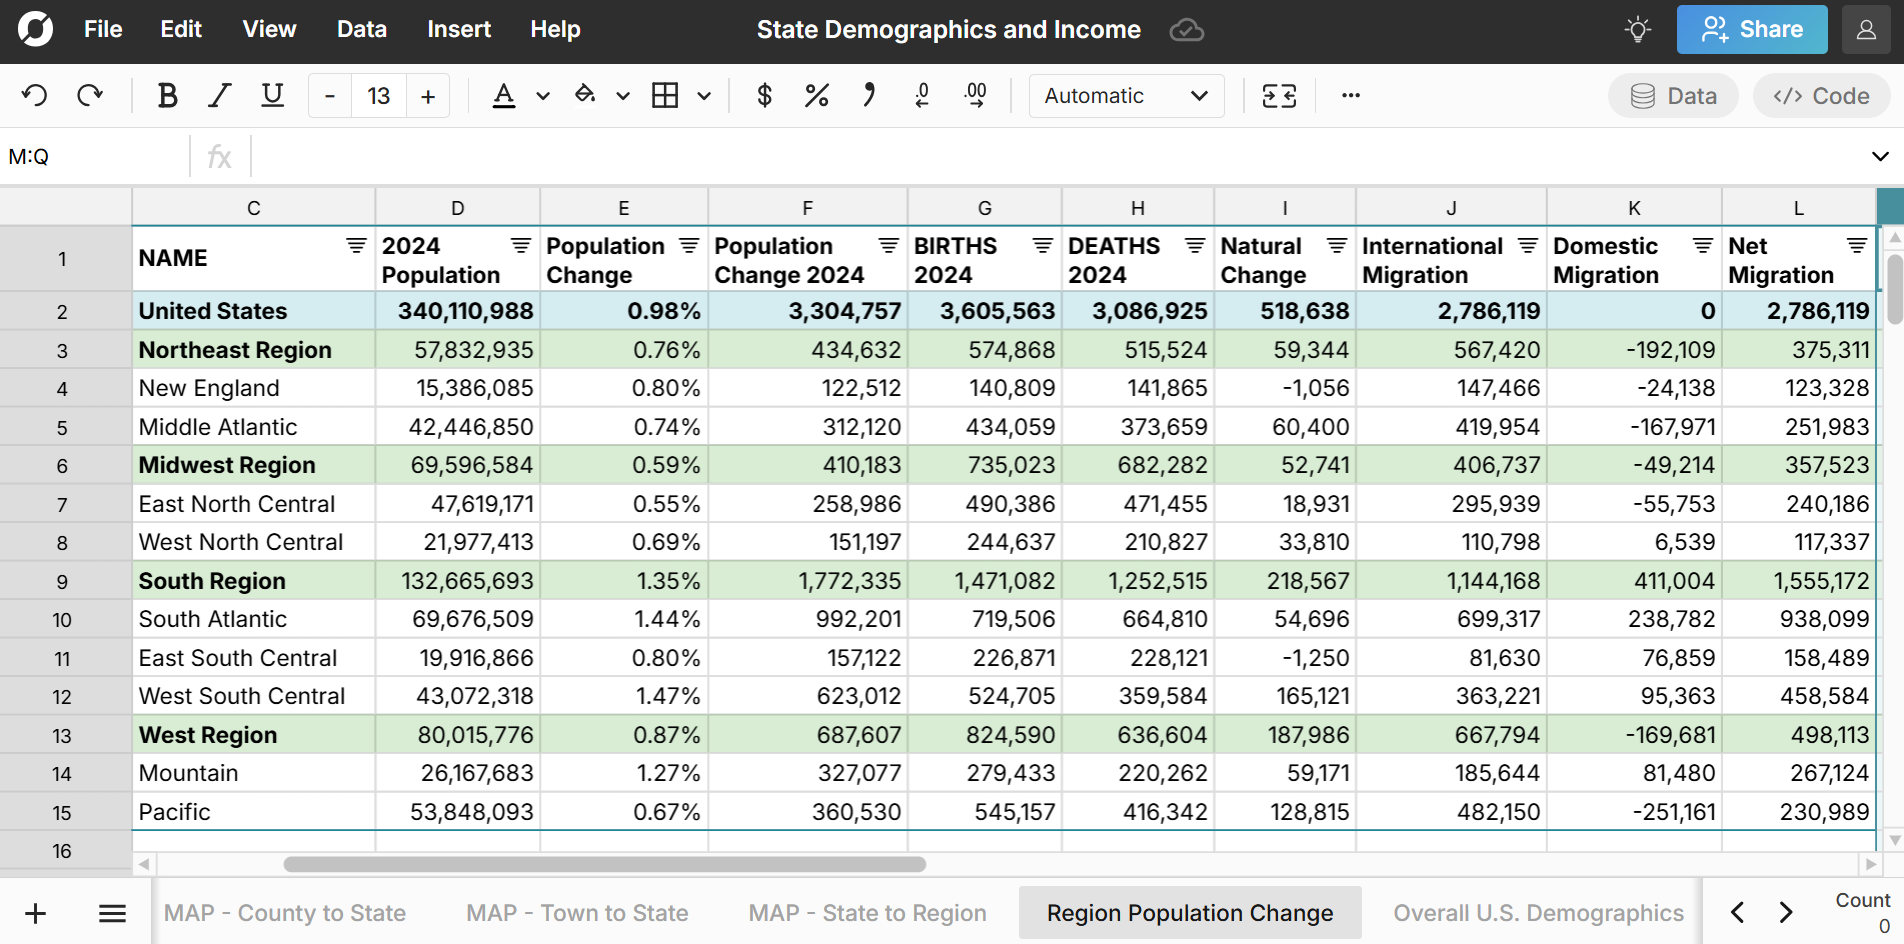
Overall U.S. Demographics and Income
The last two sheets include overall U.S. demographic and income data so you can compare each state to the U.S. overall.
Highlights from the Dataset:
Largest States in the U.S.
Top 10 most populated states in America:
- California - 39,431,263
- Texas - 31,290,831
- Florida - 23,372,215
- New York - 19,867,248
- Pennsylvania - 13,078,751
- Illinois - 12,710,158
- Ohio - 11,883,304
- Georgia - 11,180,878
- North Carolina -11,046,024
- Michigan- 10,140,459
Compare this to the median state population of 4,430,372 residents. You can also easily filter the spreadsheet to see the largest states by race, age group, or gender breakdown.
Best and Worst States
The following are states that rank highest or lowest on a demographic statistic in the most recent year of data available. Note that most of these statistics are rolling 5-year estimates.
State Population growth
- Fastest growing state by population: Texas +562,941
- Fastest growing state by percentage: Florida +2.04%
- Fastest shrinking state by population: West Virginia -516
- Fastest shrinking state by percentage: Vermont -0.03%
State Migration Inflows and Outflows
- Most domestic migration gain: Texas +85,267
- Most domestic migration gain (as %): South Carolina +1.24%
- Lost most domestic migration: California -239,575
- Lost most domestic migration (as %): Hawaii -0.64%
- Most international migration: Florida +411,322
- Most international migration (as %): Florida +1.76%
States by Age and Gender
- Highest percent 65 and older: Maine 21.9% 65 and older
- Highest percent Under 18: Utah 28.3% under 18
- Highest percent Under 5: Utah 7.1% under 5
- Highest Male percentage - Alaska 52.5% are Male
- Highest Female percentage - Mississippi 51.5% are Female
States by Income
- Highest income state: Maryland - $101,652 median household income
- Lowest income state: Mississippi - $54,915 median household income
- Most unequal income state: New York - 1.49 mean to median income ratio (Mean of $157,604 and median of $106,287)
- Highest percent making $200K or more: Massachusetts at 21.1%
Data Sources
Data sources for this U.S. state dataset include the U.S. Census Bureau 5-year estimate tables from the American Community Survey, as well as the U.S. Office of Housing and Urban Development. Data has been updated as of February 2025 with the most recent data available.