Data tables are a convenient way to view, manage, and transform large datasets in your spreadsheet and maintain live data connections to keep data in sync. By default, every pivot table in Row Zero is a data table which maintains a live connection to your source data. Any time your source data changes, your pivot table dynamically updates. The same is true any time you connect directly to your data source to import data - the data is imported as a Connected Table which maintains a live connection to your data source that dynamically updates with data refresh.
Based on feedback, we recently updated the way you interact with data tables:
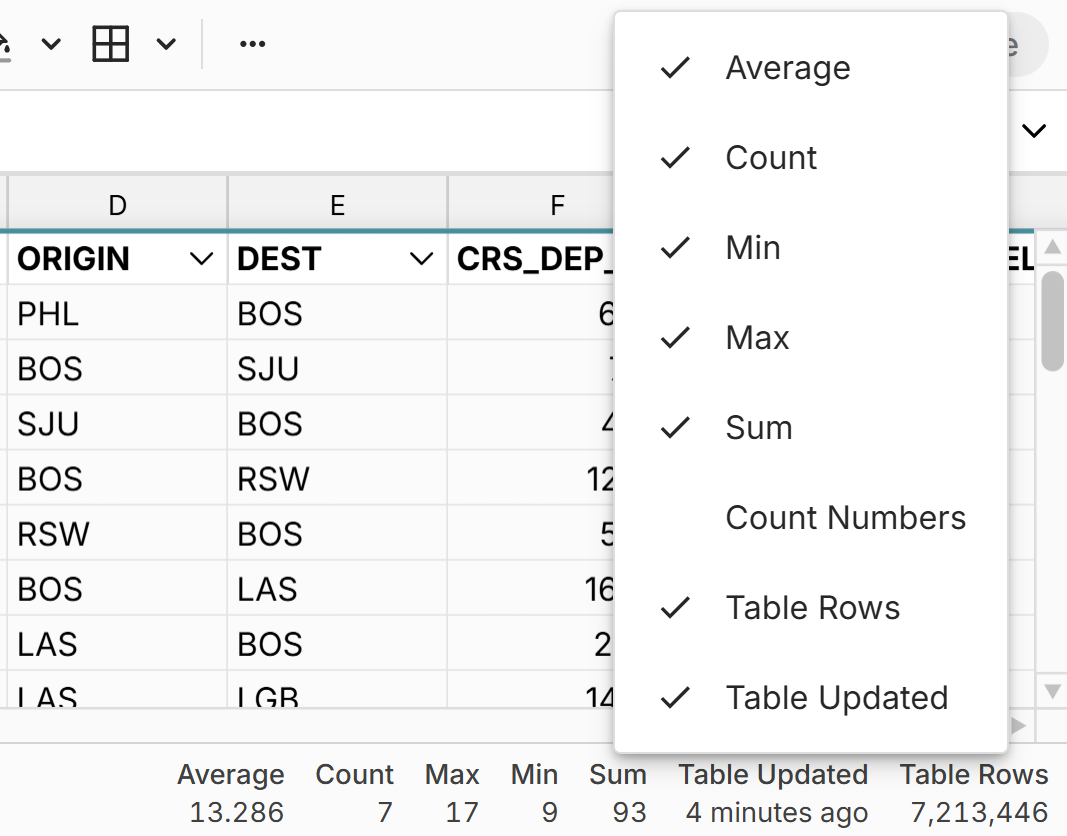
Customize your summary stats: We've moved all summary stats to the bottom right corner of the workbook and now let you customize summary stats for data tables (as well as cell ranges). Here's where you can find the number of table rows and when the table was last updated. Click once in the bottom right to toggle the menu.

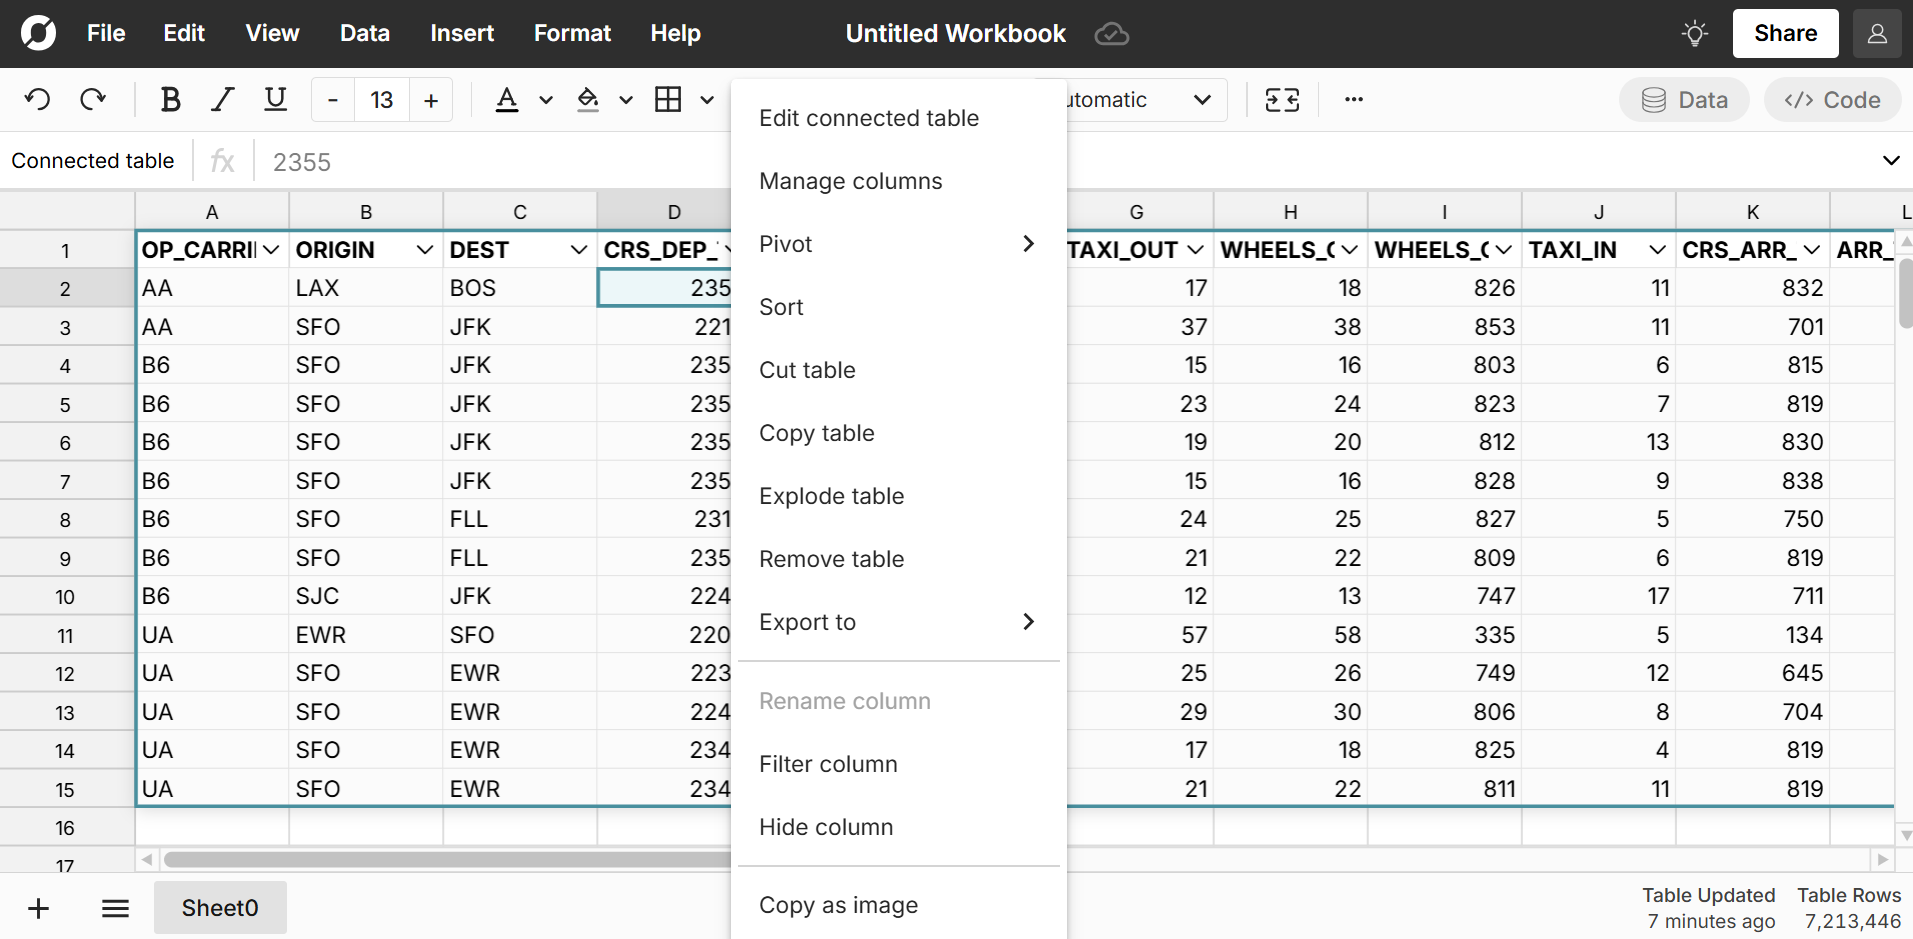
Right-click to access Data Table menu:
 You've always been able to do this, but this is now the primary way to interact with a data table menu. As you can see, there are some powerful options for interacting with data tables. In addition to the typical edit, sort, and filter, you can easily duplicate, pivot, export, explode, and manage columns. Export to CSV, Postgres, Snowflake, etc. and the ability to pivot a pivot table are powerful features unique to Row Zero.
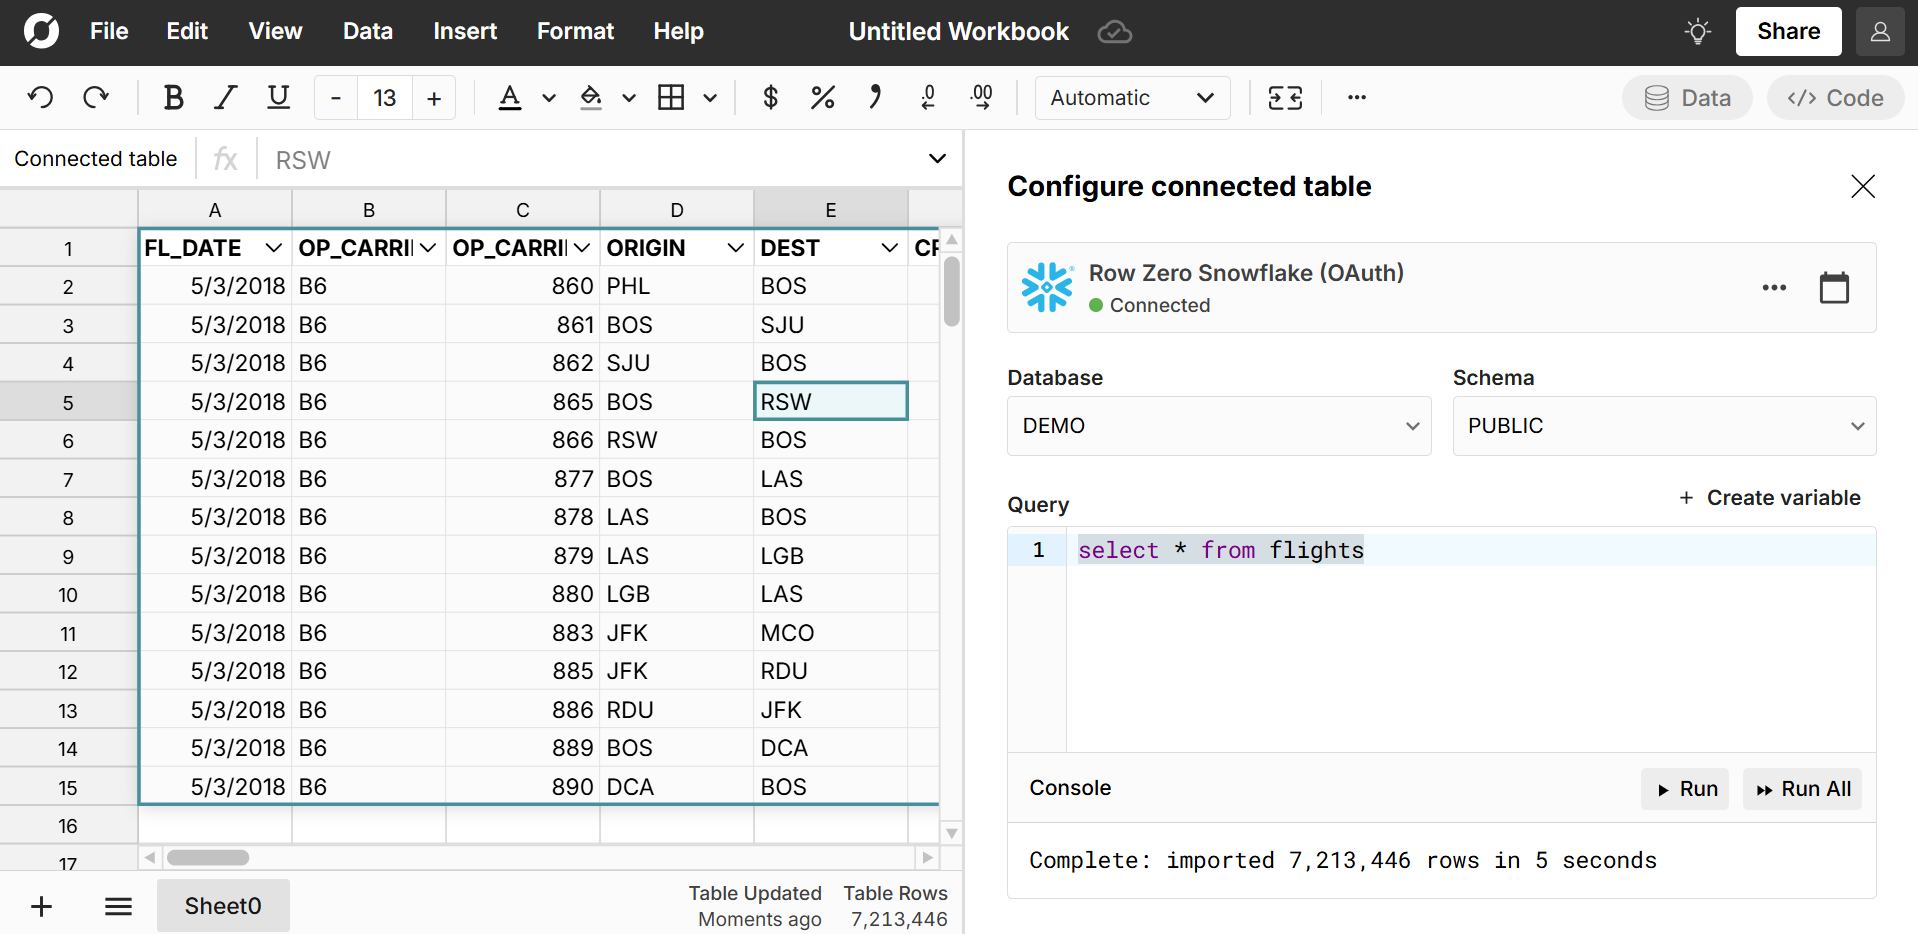
As always, you can open the SQL editor to edit a connected table by double clicking anywhere in the connected table.

To try out data tables in Row Zero, you can create a pivot table, connect to your data source to create a connected table, or import a file as a data table.